This is How We Determined Investors Lost $27.7 Billion Investing in Non-Traded REITs
Apr 2014
Earlier this week we posted the summary results of our investigation into the performance of 27 non-traded REITs which had had a liquidity event by December 31, 2013. We found that investors are $27.7 billion worse as a result of investing in these 27 REITs rather than investing in a diversified portfolio of traded REITs. The post titled "Retail Investors Have Lost at Least $27.7 billion as a Result of Non-Traded REITs" is available on our blog.
Figuring out this $27.7 billion shortfall required a tremendous amount of work - far more than required to determine the relative returns of most of investments.
First we determine the amount and timing of investments into each non-traded REIT by investors unaffiliated with the REIT. These investments are purchases of shares directly and additional purchases through dividend reinvestment programs. We next determine the cash flows back out to investors in the form of redemptions and cash distributions not reinvested. We then apply the flows in an out of the REIT to the Vanguard Real Estate Index Fund (Ticker: VGSIX). Information on this fund can be found at the Vanguard website. On the liquidity date, we compare the value of unaffiliated investors' holdings in the non-traded REIT with the value of what they would own if the same inflows and outflows had been made on the same dates in the VGSIX. $27.7 billion is the difference between what investors would have had if they had invested in traded REITs and what they did have as a result of the non-traded REIT investment.
Columbia began selling shares to investors on November 26, 2003, so the first fiscal year ended December 31, 2003. We gathered each 10-K thereafter until Columbia was listed on the NYSE in 2013 and the three 10-Qs Columbia filed in 2013 before it is listed. The 10-Ks and 10-Qs can be downloaded from the SEC website.
Columbia began selling shares to investors on November 26, 2003, so the first fiscal year ended December 31, 2003. We gathered each 10-K thereafter until Columbia was listed on the NYSE in 2013 and the three 10-Qs Columbia filed in 2013 before it is listed. The 10-Ks and 10-Qs can be downloaded from the SEC website.
For each filing, we ask three questions.
How much cash did non-affiliated investors put into the REIT during the period?
How much cash did those same investors receive from the REIT during the period?
When did the cash flows happen during the period?
Cash Flows in Fiscal 2003
You can find the Columbia Property Trust ("Columbia") financial statements for fiscal 2003 on the SEC website. The Statement of Cash Flows shows $1,000 was raised from an equity sale. Note 1 in the Notes to the Financial Statements says the cash is from an affiliated advisor, which means we will record it but ultimately don't want to include it in our results since we are trying to determining how unaffiliated investors fared. There were no other cash inflows from investors, and there were no cash outflows to investors reflected on the 2003 10-K.
Columbia's 2003 10-K also provides some helpful background information. For example, Columbia has a Dividend Reinvestment Plan ("DRP") which gives investors the option of re-investing their dividends rather than receiving the dividends in cash. Columbia also has a Share Redemption Program ("SRP") under which investors can sell shares back to the trust, subject to several restrictions. Specifically, the trust will redeem shares for less than investors paid and will not spend more redeeming shares than it receives from selling DRP shares. Although Columbia frequently changed the rules in future years, some version of both of those restrictions survives.
Cash Flows in Fiscal 2004
Columbia's 10-K for fiscal 2004 is also available on the SEC website. The Statement of Cash Flows has more activity than the prior year, and raises some questions. We'll go through the capital activity and related questions one at a time.
1. Columbia raised $792,012,000 selling stock. Who bought the shares? We do not find any reference to shares purchased by affiliates or related parties so we assume all of the shares were purchased by non-affiliates.
Is the dollar amount net or gross of fees? Both the Statement of Cash Flows and Note 1 in the Notes suggest the amount is gross of fees. That is good, because when we compare investments we want to track all cash paid by investors, not just the part of their cash that was invested in real estate.
2. Columbia spent $690,000 to redeem stock. Was the stock redeemed under the SRP? According to Note 1, the stock was redeemed "pursuant to [Columbia's] share redemption program." Notice in Note 6 that the SRP has changed and now cannot be more than 50% of the DRP proceeds in the current calendar year.
Where is the related DRP activity? Remember, the SRP is limited by the amount of DRP activity. So if Columbia spent $690,000 to redeem stock, investors must have purchased at least $1,380,000 worth of stock through the DRP. There is no mention of DRP activity in the 10-K, but after digging around we find some useful information in the 3Q 10-Q. The 10-Q does not directly report DRP activity, but it does report something called "Redeemable Common Shares." It turns out that Redeemable Common Shares are the difference between proceeds from DRP shares in the current year and proceeds spent on SRP shares in the current year (see the discussion of Stockholders' Equity in Note 6). This means that, as of September 30, 2004, DRP proceeds are equal to Redeemable Common Shares plus money spent through the SRP. Although we cannot use this method to calculate DRP activity for the entire year, we know that $3,923,000 of Columbia's dividends in the first three quarters of the year waspaid by issuing more shares to investors.
3. Columbia paid $16,613,000 to investors as dividends. Is the dollar amount cash paid, or does it include the dividends paid as DRP shares? We know that at least $3,293,000 of dividends was reinvested as DRP shares. Neither the Statement of Cash Flows nor the Statement of Stockholders' Equity for fiscal 2004 has a separate category for issuance of common stock from the DRP, so it must be that the "Issuance of Common Stock" includes shares issued through the DRP. If that line item includes DRP proceeds, the only way for the Statement of Cash Flows to tie out is for dividends to include DRP shares. This means that investors received no more than $13,320,000 in cash from dividend payments. They likely received less, but we cannot tell how much of the 4Q dividend was paid in DRP shares.
In summary, the 10-K for fiscal 2004 suggests that investors contributed $788,719,000 and received no more than $14,010,000.
Finally, we assume that non-affiliated investors use the DRP and SRP programs in the same proportion as affiliated investors. Thus, some of each year's DRP and SRP activity is attributed to affiliated investors in proportion to the number of shares held by affiliated investors at the end of the prior fiscal year.
Cash Flows in Fiscal 2005-2012
We follow the same process for fiscal 2005 and 2006 that we used for 2004. Beginning in 2007, we no longer need to estimate how many shares were issued through the DRP. Although the 2007 financial statements do not present the number of DRP shares, the 2009 financial statements (link) include the number of DRP shares for fiscal 2007 and 2008. We can therefore directly calculate proceeds from the issuance of common stock (excluding DRP shares) and cash returned to the investor via dividends and SRP shares (excluding dividends paid through DRP shares). In fiscal 2013, we use 10-Q's because Columbia is listed shortly after the end of 3Q.
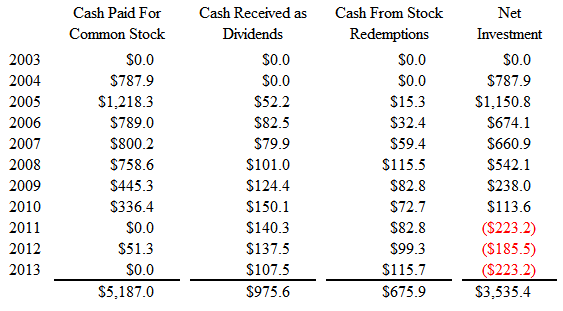
Table 1 presents our estimate of how much cash non-affiliated investors put into the trust and how much cash they received in each year. Unaffiliated investors paid $5.19 billion for Columbia shares, received $976 million in cash dividends and $676 million in sales proceeds for a net investment of $3.54 billion at the time of the liquidity event.
"Table 1. Cash contributed by and received by non-affiliated investors in each fiscal year (in millions).
To check the reasonableness of our calculations, we collect the same data points in number of shares instead of dollar amounts and calculate how many shares were held by non-affiliated investors. We then compare our calculation to the number of shares held by non-affiliated investors as sometimes reported in small print at the beginning of the 10-K. We do not expect to get the same number, because the REITs definition of non-affiliated investors does not necessarily match ours, but we should be close. The fiscal 2012 10-K reports that non-affiliates held 547,081,420 shares as of June 30, 2012. Our estimate is 547,161,436 as of December 31, 2012, which is quite close.
The next step is to determine when the cash flows happened during the year. This is difficult, as the 10-K's only provide one data point per year. We improve our estimates of the timing of cash inflows by examining 424b3's filed by Columbia between the 10-K filings. See the 424b3 filings. These forms are filed sporadically when they are filed at all, often disclose total gross proceeds accumulated from the first capital raise to a specified date in the 424b3. Between the dates for which cash inflows are known (424b3 and 10-K dates), we assume that cash is invested in the trust evenly over time. This is equivalent to assuming that the cash is invested at the average price during the intervening time period.
Cash outflows are comprised of two components: dividends and stock repurchases. The timing of dividend payments is fairly easy to estimate; Columbia's 10-Ks indicate that the dividend is paid quarterly. In Columbia's case, the dividend paid each quarter is disclosed on a table in the 10-K. For REITs that disclose total dividends for the year rather than each dividend payment, we assume that the dividend is the same in all four quarters (or twelve months, as appropriate).
The second component of cash outflows is share repurchases. Share repurchases are only reported in financial statements, so we assume that the share repurchases happen evenly between financial statement filings.
The Liquidity Event
We estimate how much could be realized by non-affiliated investors by multiplying the liquidity event price by the number of shares held by non-affiliates in the immediately preceding SEC filing. This assumes all investors could have sold their shares on the first day of the first liquidity event, even though the liquidity event often only allows some of the shares to be liquidated. We read press releases to determine when the liquidity event first happens, and then use either press releases or historical pricing data to determine how much each share was sold for in the liquidity event.
After all of this analysis, we finally have what we are looking for: the cash into and out of the non-traded REIT over time, incorporating proceeds, distribution reinvestment, redemptions, distributions, and transactions with affiliated entities. This is a lot of work, but it allows us to directly compare the returns that investors have realized versus a diversified, liquid, low-cost benchmark. When we apply the daily net investment (the amount of cash that actually went to or came from the non-affiliated investor) to the Vanguard Real Estate Index Fund (Ticker: VGSIX) for the 27 non-traded REITs that have had liquidity events, we find that investors would have been $27.7 billion better off without non-traded REITs.
Unaffiliated investors in the Columbia REIT had shares worth $3,030,135,756 at the liquidity event on October 10, 2013. Investors had paid $3.54 billion net of dividends received and redemption proceeds for these shares and so suffered an out of pocket loss of $500 million. If these investors had instead put their money - in the same amounts on the same dates - in liquid, traded REITs they would have had investments worth $6,238,578,884. They would have had an out of pocket gain of $2.7 billion instead of an out of pocket loss of $500 million. Thus investors lost $3,208,443,128as a result of being sold this non-traded REIT instead of traded REITs.