Retail Investors Have Lost at Least $27.7 billion as a Result of Non-Traded REITs
Apr 2014
As part of our effort to help investors avoid non-traded REITs, we have written over 25 blog posts on this defective investment type. We have noted in our research that because of high costs, illiquidity, lack of transparency and conflicts of interest, non-traded REITs should underperform liquid, low-cost traded REITs. A number of our blog posts including our post on the early trading in NYRT last week, titled "NYRT's Listing is More Evidence That Even the Non-Traded REITs Winners Are Losers", have calculated the amount investors are worse off as a result of being in the non-traded REIT instead of a diversified portfolio of traded REITs.
Research on how investors fared in non-traded REITs is extremely difficult because non-traded REITs' SEC filings report approximate offering proceeds accumulating during offerings which may last many years. We are not aware of any prior thorough analysis of what returns investors have earned in non-traded REITs. In this vacuum of hard evidence, self-interested commentary has continued to tout non-traded REITs as a reasonable - even preferable - alternative to traded REITs. Over the next several weeks, we are going to roll out the result of our in depth investigation of the returns retail investors have experienced in non-traded REITs.
We report the results of our analysis first for the non-traded REITs that have had a "liquidity event" or gone through the "full life-cycle." This bit of industry jargon means the REIT has listed and secondary market trading commenced or the REIT has merged into a traded REIT or another non-traded REIT which provided some option for investors to cash out their shares. These REITs tend to be non-traded REITs whose real estate portfolios have generated enough income and increased in value sufficiently to pay for distributions and for the extraordinarily high embedded fees charged by non-traded REITs.
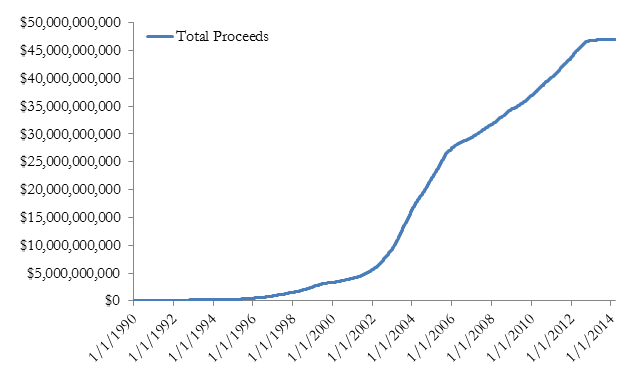
The figure shows that the 27 non-traded REITs that have merged or listed raised $46.1 billion through their public offerings and dividend reinvestment programs.
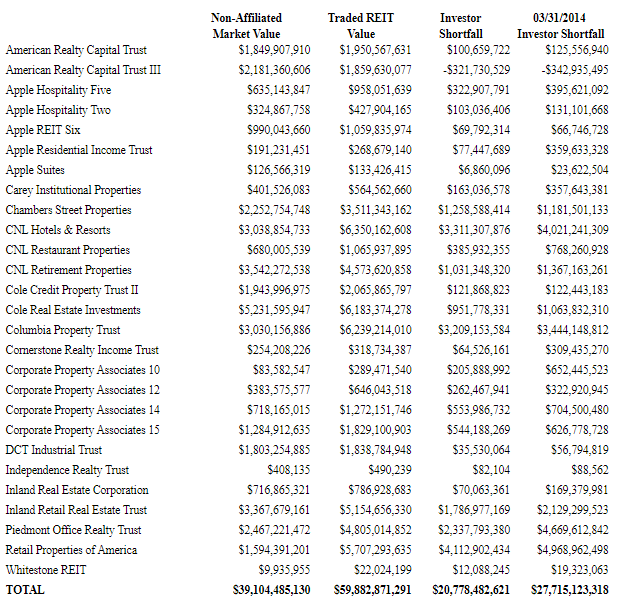
Table 1 reports the $20 billion investors have lost as a result of investing in non-traded REITs which have had a liquidity event. Despite the lack of liquidity and diversification, investors in 26 of the 27 non-traded REITs that have listed or merged as of 2013 had lower returns than if they had just invested in a liquid, diversified portfolio of traded REITs. Bringing forward the shortfalls as of the liquidity event date to the present at the returns to traded REITs, the shortfall grows to $27.7 billion.
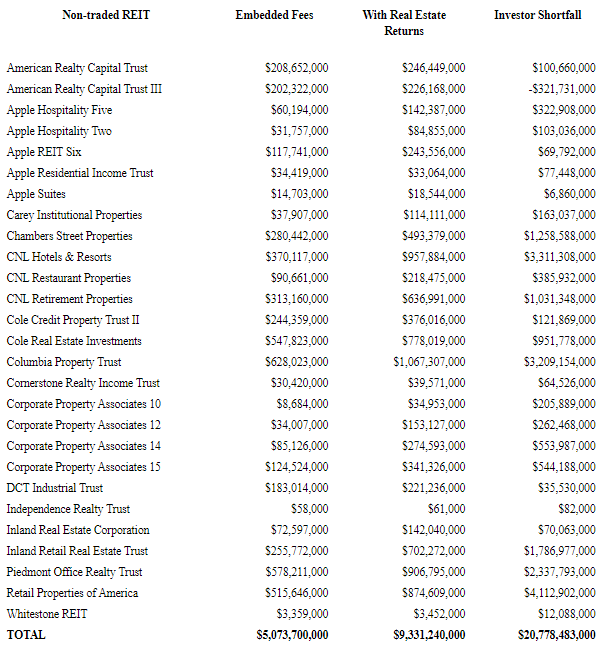
These losses relative to traded REITs are a predictable result of the extraordinary offering costs and ongoing conflicts of interest in non-traded REITs which are largely absent in traded REITs. Table 2 reports the estimated embedded fees charged by the sponsor in each non-traded REIT brought forward to the liquidity date alongside investors' shortfall for each REIT.
Additional posts over the next three weeks will detail our calculations and explore other aspects of non-traded REITs which should make them per se unsuitable given the widespread availability of lower risk, higher return alternatives.