1) "Reg D Offerings Summary Statistics" here,
2) "$8 Trillion of Broker-Sold Reg D Offerings" here,
3) "HJ Sims Reg D Offerings: Heads Sims Wins, Tails their Investors Lose" here, and
4) "Inactive and Delinquent Reg D Issuers" here.
You can download and print or email this post by clicking here.
Introduction
In a recent note, we explained how HJ Sims executives formed 91 separate legal entities through which they could personally profit at their clients' expense. These entities - owned and/or controlled by HJ Sims executives - issued $2.2 billion in Reg D securities, which HJ Sims sold to its clients. If a Reg D offering failed, the Sims' executives would suffer a small portion of the losses. In many of these offerings, if an offering succeeded the executives would realize all the gains - HJ Sims' clients were simply providing unsecured loans to HJ Sims executives to fund these executives' personal investments. Thus, in addition to commissions and other fees associated with the offering, HJ Sims executives stood to reap substantial profits while bearing only a small portion of the losses on over $2 billion in Reg D securities it sold to clients.
80% of Reg D offerings are not sold through broker-dealers like HJ Sims but are instead sold directly by issuers. These issuers are often not operating companies raising capital to expand operations but a series of special purpose entities put together by a sponsor to issue securities for the benefit of the financial professionals who own the sponsor. One such serial sponsor is First National Realty Partners.
First National Realty Partners
FNRP's Reg D program differs in interesting ways from the HJ Sims' program. FNRP's approach to skinning cats follows a steady, sure approach combining "lifecycle" non-traded REITs' extraordinary fees with private equity's carried interest on steroids. Unlike the HJ Sims' Reg D offerings which incentivized high risk underlying investments, the FNRP Reg D offerings benefit its owners by slow, steady underlying cashflows that FNRP are able to skim off.
Unlike HJ Sims, FNRP is not a brokerage firm and so does not have a captive retail client base to which it can sell Reg D securities. FNRP could sell through broker-dealers but would have to pay very substantial commissions. Instead, FNRP maintains a website touting its commercial real estate backed Reg D offerings. Potential investors who register with the website and affirm they are accredited investors are sent Offering Memoranda. See www.fnrpusa.com.[1]
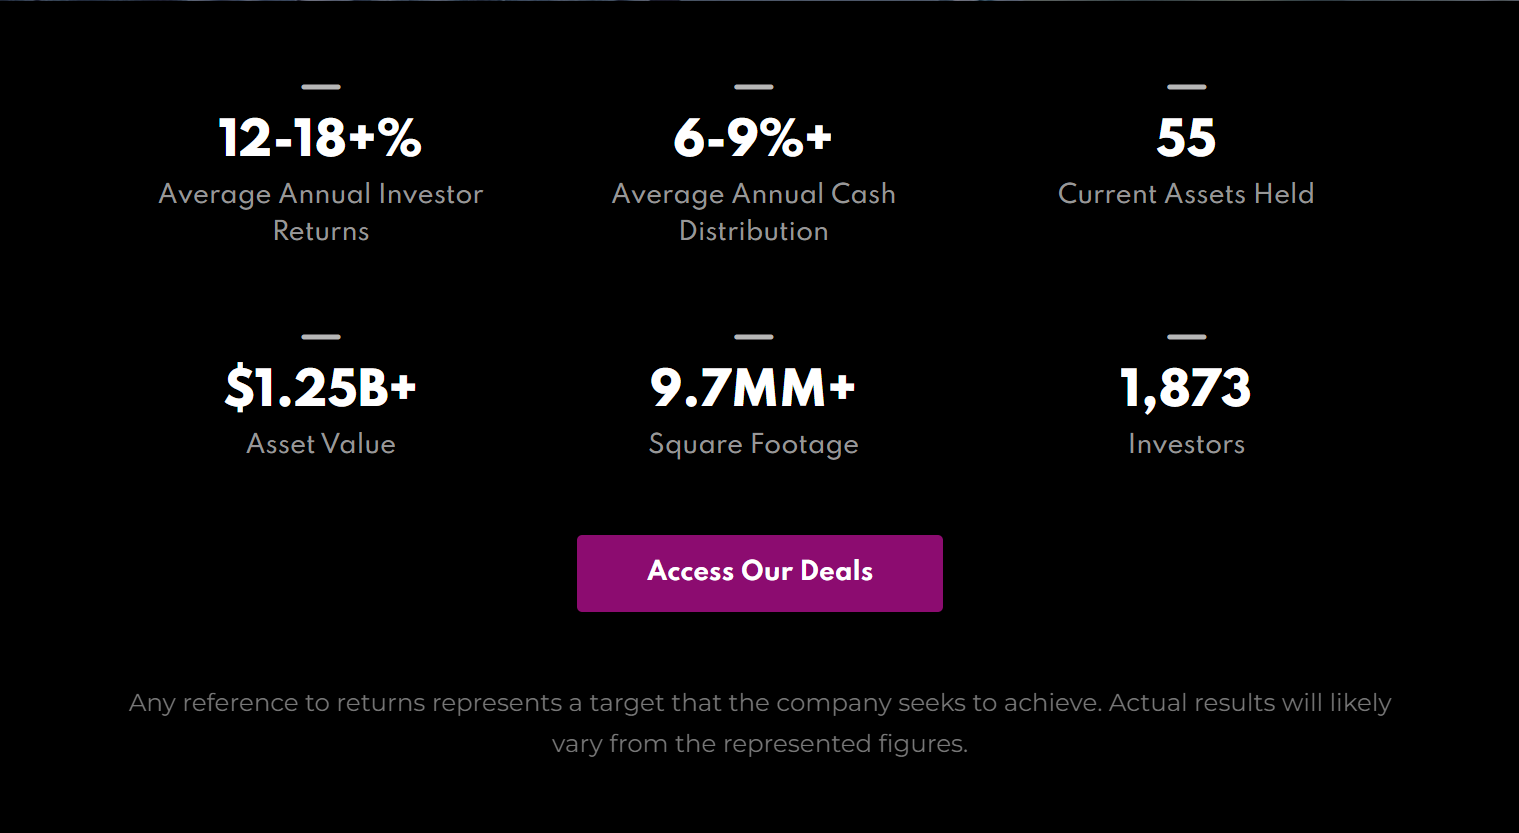
FNRP's website touts 12-18+% average annual investor returns but doesn't specify whether these are returns FNRP investors have earned in the past or are likely to earn in the future. See Figure 1. Either way, the claim is almost certainly false. Vanguard's REIT index fund which tracks US traded REITs has had an 8.1% annualized return over the past 25 years.
Figure 1: FNRP's Current Representations to Investors, Check the Fine and Faded Print
After writing the previous paragraph, we noticed tiny, faded grey print which is virtually invisible against the black background: "Any reference to returns represents a target that the company seeks to achieve. Actual results will likely vary from the represented figures." FNRP intentionally places the most important information in its graphic - information necessary to make the bright white information not misleading - in font that is smaller, thinner and more transparent. Figure 2 uses the code embedded in FNRP's website to illustrate how FNRP's choice of background and fonts is so effectively deceptive.
Figure 2: FNRP Obscures Information Necessary to Make the Highlighted Information Not Misleading
As we explain below, FNRP takes more than half of investor's returns in equity distributions, "carried interest" and asset management fees while charging separately for the services provided for by the traded REITs. Without published audited financials and investor returns we can't verify FNRP's actual average annual investor returns but FNRP's business model could not deliver investor returns of more than 3% or 4% per year on average when properly accounted. FNRP could post on its website audited financials and realized investor returns but does not do so because then investors would see the miniscule net returns left after the huge bite FNRP takes from what are simple market returns.
FNRP's website has a couple of anecdotes describing investment successes. Potential investors could be forgiven for believing 12-18+% reflected some experience or was based on reasonable expectations rather than pure fiction.
The basic economics of FNRP deals is simple. A special purpose entity is created to buy a mature strip mall, leased in part by name brand tenants like Best Buy, Home Depot or Aldi. The price at which these mature commercial developments trade is the expected present value of the risk adjusted cashflows from the investment. Investors buying and selling mature properties ensure that the expected returns are approximately equal across similar properties. FNRP is not buying these properties at below market prices as it claims. FNRP buys a property at or above market and shaves more than half the returns for itself.
Maple Park SC Realty Fund LLC
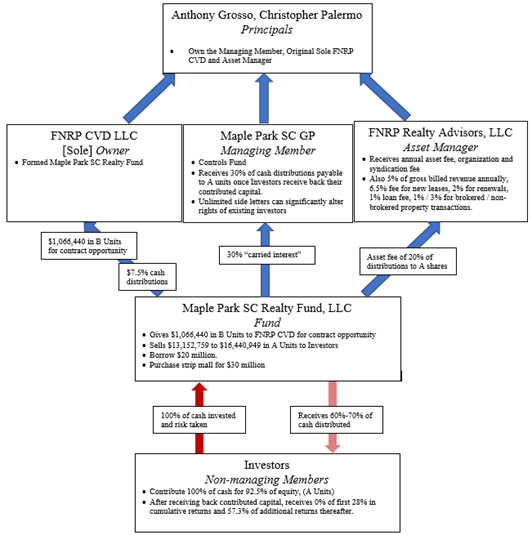
Maple Park SC Realty Fund LLC (the "Fund") is a good illustration of FNRP's scheme. See Figure 3.
FNRP's owners organize the Fund to invest in a strip mall. They extract most of the potential profits from this investment through three entities they own - FNRP CVD LLC, Maple Park SC GP and FNRP Realty Advisors, LLC.
FNRP CVD LLC (the "Owner") forms the Fund and contributes the identified contract opportunity in exchange for 7.5% of the Fund's equity.
Maple Park SC GP (the "Managing Member") controls the Fund and receives 30% of all cash distributions otherwise payable to A Units held by the public investors once these investors receive back their contributed capital.
FNRP Realty Advisors, LLC (the "Asset Manager") receives annual asset fee (1% of project purchase cost or 20% of distributions to A units), Organization and Syndication Fee of 1.9% of project purchase cost. In addition to the asset management fee, the Asset Manager may charge the Fund 5% of gross billed revenue annually, 6.5% fee for new leases, 2% for renewals, 1% loan fee and 1% / 3% for brokered / non-brokered property transactions.
Figure 3: Maple Park SC Realty Fund, LLC Organizational Chart
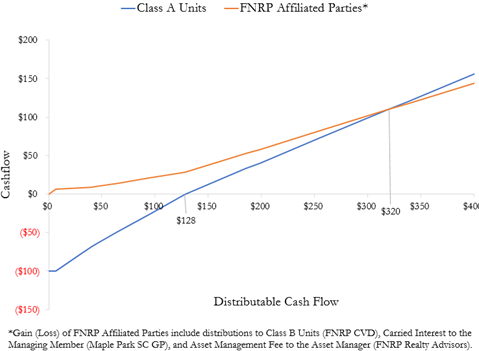
Setting aside the above-market fees FNRP may charge the Fund through the Asset Manager, FNRP's owners receive $28.10 in distributions up through when public investors receive back their $100 in capital contributions. See Figure 4. Thereafter, FNRP's owners receive $82 and public investors $110 of the next $192. By the time $320 per $100 invested in A Units is distributed, the three entities owned by FNRP's owners would have received $110 on a $0 investment while public investors would have received $110 on a $100 investment. In addition to the $110, FNRP's owners have wide discretion to advantage themselves through payments from the Fund to affiliated entities they own for services which might typically already be covered by the asset management fee.
FNRP's owners receive $28 per $100 of investor capital before investors get the first $1 beyond their original investment. Investors net distributions don't catch up to the distributions taken by FNRP's owners until $320 is distributed per $100 of initial capital. It would take 15 years at the 8.1% long run returns to commercial real estate for the returns to accumulate to this level. Thus, FNRP would take half the profits from mature investments over 15 years while investors receive half the market's returns holding an illiquid investment.
Figure 4: Three FNRP entities extract almost all the profits.
Appendix 1 lists Reg D offerings in which FNRP or its owners participated. FNRP's owners claim extraordinary experience and success in their self-published books in 2015 and 2016, even though there was no prior Reg D activity at that time. Most FNRP's Form Ds were filed with little of the maximum offering amount sold. The recent offerings for which we have private placement memoranda provide that investor capital will be returned if the minimum necessary to purchase the contemplated investment property is not raised. FNRP registered its offerings in Delaware which requires only an initial filing and does not require annual filings so we can't tell how many of FNRP's Reg D offerings were completed and of those which were completed how many have since failed, paid out or continue in operation.
Conclusion
Our recent research into the Reg D securities offerings has documented nearly $5 trillion in exempt securities sold in the past two years. Our research has also uncovered series of offerings which differ wildly from the capital formation and investor diversification benefits promised by advocates of relaxed registration requirements. In a previous post we illustrated how one brokerage firm was able to use Reg D exemptions to enrich themselves while pushing most of the investment risks onto their retail clients. In this post, we illustrate an alternative way that finance professionals can use Reg D to fleece investors.
Appendix 1: First National Realty Partners Reg D Offerings.
[1] According to its website, First National Realty Partners was founded by Anthony Grosso and Christopher Palermo. They were previously securities brokers with a series of marginal, high-risk brokerage firms with high rates of customer complaints including at least one expelled firm each. Although neither have customer complaints listed on their BrokerCheck records, their biographies including registration and employment histories are singularly unimpressive. Anthony Grosso's BrokerCheck Report can be viewed here. Christopher Palermo's BrokerCheck Report can be viewed here.