Some investors may think that while ETFs are subject to various tracking errors, ETNs are not. The argument goes that index-tracking ETFs often hold part or the entire portfolio underlying their targeted index and are thus subject to imperfect tracking and transaction costs. ETNs, on the other hand, are debt instruments, and have returns guaranteed by their issuers.
It turns out, however, that the daily return of an ETN investment may not necessarily equal the leverage ratio times the daily return of the index the ETN is supposed to track, and there are several reasons for this. Here we will use TVIX, a "2x long" ETN tracking the S&P 500 VIX Short-Term Futures Index ER (SPVXSP), as an example.
First, the way the TVIX ETN tracks the SPVXSP index is through the calculation of the so-called "Closing Indicative Value". Basically this is a value starting from $100 on the inception date, and then updated on each calendar day based on its value on the previous day and a computed daily return. Although 2 times the SPVXSP is an important, or probably the most important component of this computed daily return, it also includes a daily accrual return and a daily investment fee. Both of these two factors could contribute to the deviation of the Closing Indicative Value return from the leveraged index return.
Second, a TVIX holder may redeem the notes he holds at the Closing Indicative Value, but this redemption is subject to an early redemption charge which will be equal to 0.05% of the Closing Indicative Value.
Third, when TVIX are traded in the secondary market on an exchange, its price may deviate significantly from the Closing Indicative Value. As one of our previous blog posts has shown, in certain days of this February and March, TVIX has been traded above the Closing Indicate Value by a large amount. Again, this means that the return an investor obtains from trading TVIX on exchange deviates from the leverage index returns.
Fourth, although it may be unknown to many investors, the Closing Indicative Value for TVIX has a lower bound of zero. In other words, if the Closing Indicative Value ever hits the level of zero, it will remain zero afterward. In this case, the ETN will stop tracking any movement of the underlying index.
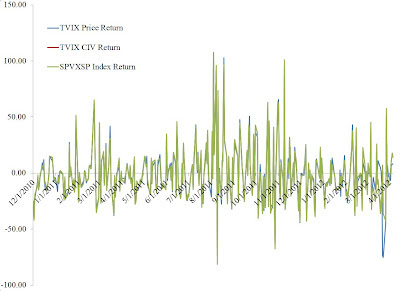
The following figure depicts the three types of annualized daily returns in percentage point since the inception of TVIX: the return on the closing price of TVIX, the return on the Closing Indicative Value of TVIX, and 2 times the return on the SPVXSP index. Although there seems to be frequent discrepancies between the return on the price of TVIX and that on the leveraged index return, the Closing Indicative Value return mostly overlaps with the leveraged index return. In fact, since the inception of TVIX, the largest deviation between the daily returns of the Closing Indicative Value and the leveraged index return is 0.054% after annualization. This means the third factor we identified above, namely the discrepancy between the Closing Indicative Value and the trading price, seems to be playing the biggest role in driving TVIX's return away from its leveraged index return, at least for now.