SLCG Economic Consulting's Logo

Blog

Investors "Strangled" by LJM Preservation and Growth Fund (LJMIX)

The stock market began the month of February on a roller-coaster. During the 6 trading days from Friday, February 2nd to Friday, February 9th, the Dow Jones Industrials had intraday swings of at least 330 points each day. On four of those six days the Dow incurred 1,000 point swings.

Amidst the dramatic market swings two weeks ago, the LJM Preservation and Growth Fund stands out. The Fund plummeted over 80% (from a price of $10.34 to $1.94) in two days. See Figure 1.


Figure 1. LJM Preservation and Growth Fund Class I, Stocks and Bonds, 2014-2018A figure showing a line graph demonstrating prices of LJM Preservation and Growth Fund Class I stocks and bonds from 2014 to 2018.


The LJM Capital Preservation and Growth Fund was launched in January 2013 and sold in three different share classes (ticker symbols LJMAX, LJMCX, LJMIX). The Fund had net assets of $768 million as of the latest Annual Report filed on October 31, 2017. If the Fund's net assets were similar on February 4, 2017 immediately before the losses, investors in the Fund lost approximately $600 million in two days.

The Fund's Prospectus defines the Fund's objective as follows: "The LJM Preservation and Growth Fund (the "Fund") seeks capital appreciation and capital preservation with low correlation to the broader U.S. equity market."

Returning to Figure 1, the LJM Fund's total returns are smoother than the S&P 500's total returns but the Fund suffered large losses in 2014 and 2015 when the S&P 500 dropped. This pattern marks the Fund's strategy of picking up nickels and dimes in front of a steamroller.

More detail is given in the description of the principal investment strategies which reveals that this Fund is actually designed to pursue an uncovered short options-trading strategy:

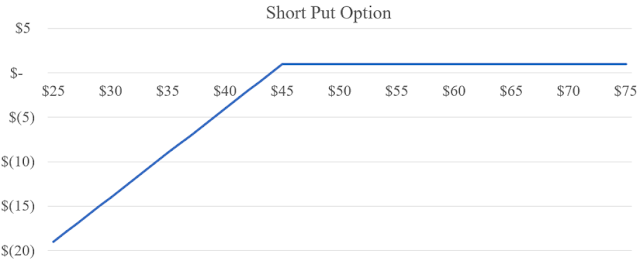
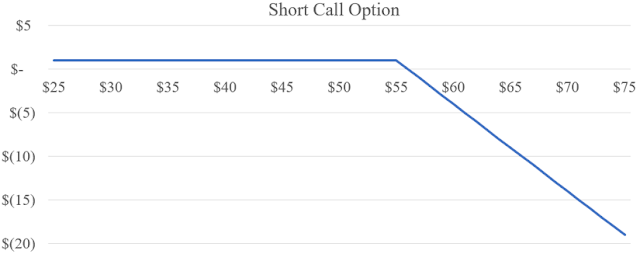
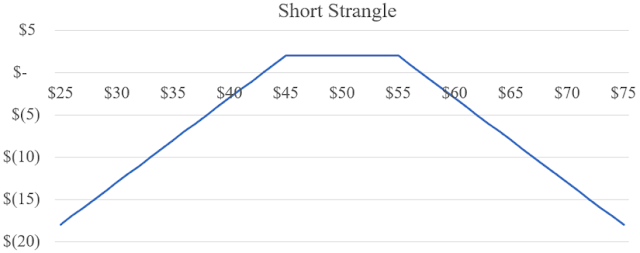
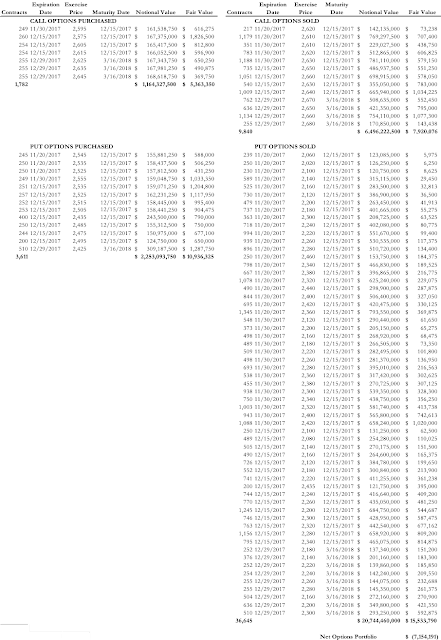
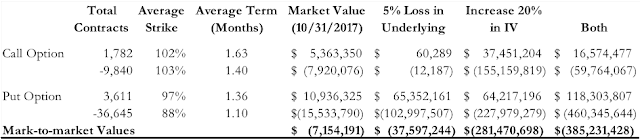
"The Fund seeks to achieve its investment objectives by capturing gains on options sold on S&P futures contracts that can be purchased ("closed") at a later date for a lower price than the price realized when originally sold.... In the aggregate, the Fund is typically "net short" in the portfolio of contracts that it holds, which means that the Fund holds more uncovered option contracts than covered."

The prospectus goes on to define an uncovered option as one in which the underlying asset is not actually held by the investor or - more precisely - the short option is not offset by a corresponding long stock, option or futures position.

The Fund's investment strategy can be discerned from the Fund's October 31, 2017 holdings. The Fund held long and short put and call on S&P 500 futures and held money market funds as collateral for the short options positions. The portfolio therefore has 5 categories of assets: money market Funds, purchased puts and sold puts and purchased calls and sold calls, (in options parlance, selling a put or call option is also called "writing" the option). The 4 categories of put and call option trades can be combined in a portfolio in various ways and can give rise to a myriad of different payoff structures. However, the LJM Preservation and Growth Fund was combining options in a very specific way.

The LJM Preservation and Growth Fund was inaptly named as it pursued the opposite of a capital preservation and growth strategy. LJM was implementing an options trading strategy called a short strangle which has unlimited downside (so no preservation) and limited upside (so no growth). Unfortunately for investors in this Fund, the option strategy is aptly named.

Figure 2a-2c illustrate short strangle payoffs. The Fund sells an out-of-the-money (strike price below the current index level) put option, receiving an upfront payment called a premium. In our example in Figure 2a, the Fund sells a put option with a strike price of $45 when the index level is $50 and receives a $1 premium. At expiration, the Fund will lose $1 for every $1 the index closes below $45. If the index closes below $44 (a $6 drop from the $50 index level when the Fund sold the put option), the Fund will have a net loss on the put option.


Figure 2a: Short Put Option PayoffsA figure showing a line graph demonstrating short put option payoffs.


The Fund also sells an out-of-the-money (strike price above the current index level) call option. In our example in Figure 2b, the Fund sells a call option with a strike price of $55 and receives a $1 premium. At expiration, the Fund will lose $1 for every $1 the index closes above $55. If the index closes above $56 (a $6 increase from the $50 index level when the Fund sold the call option), the Fund will have a net loss on the call option.


Figure 2b: Short Call Option PayoffsA figure showing a line graph demonstrating short call option payoffs.


Combining the short put option in Figure 2a with the short call option in Figure 2b creates the short strangle in Figure 2c. If the index closes above the $45 strike price of the put option sold short and below the $55 strike price of the call option sold short, the Fund keeps the $2 sum of the put and call option premiums as profit. If the index closes either below the put option's $45 strike price or above the call option $55 strike price by more than the $2 premium received, the Fund suffers losses on the strangle.


Figure 2c: Short Strangle PayoffsA figure showing a line graph demonstrating short strangle payoffs.


The Fund's holdings are a little more complicated than our short strangle example. The Fund sold put options with lower strike prices and bought put options with higher strike prices. In isolation this portion of the portfolio creates a bear put spread to the extent the put options bought and sold are in the same quantity and have the same expiration. Setting aside changes in volatility for now, a bear put spread profits if the underlying index declines.

Matching up some of the sold put options with the higher strike price put options bought leaves the remaining options naked put options which lose money if the index declines.

The Fund sold far more put options than it bought in order to generate a positive net premium on its put transactions because the lower strike price options the Fund sold were worth less per share covered than the higher strike price put options it was buying.

Once the long and short put positions were placed, if none of the puts finished in the money, the payoff to the Fund is the net premium (difference between the higher premiums garnered from selling puts than it paid to buy puts).

The Fund also sold more call options than it bought. This call-option half of the strangle strategy worked in a similar manner to the put-option half of the strategy. If the calls finished out of the money, the Fund kept the net premium which was positive since it sold enough more of the lower value, high strike call options than it bought of the higher-value, lower strike price call options.

The Fund's strategy was a bet that market volatility would not increase significantly and that the market index level would not change significantly. An unchanged index level would cause the options to expire worthless and the Fund would make money from the premiums it took in selling put and call options. However, the insidious by-product of this strategy is that if the stock market increases or decreases by a significant amount, the Fund suffers extreme losses. Further, the Fund was short volatility through the net short put and call options and would suffer losses if expected future volatility increased significantly even if the stock market index level was unchanged.

The payoffs at maturity plotted in Figure 2 do not capture significant gains or losses which may occur prior to expiration resulting from increases in volatility even if the index level is unchanged.

To further illustrate the Fund's strategy, we looked at the October 31, 2017 holdings of the Fund listed in Table 1.


Table 1. LJM's October 31, 2017 Option Portfolio Market ValueA figure showing a table demonstrating LJM's option portfolio market value on October 31, 2017.


Table 2 reports the sensitivity of the market value of the Fund's portfolio of options to changes in the underlying index and to changes in the volatility implied by its options. On October 31, 2017, LJM's portfolio of options had a market value of -$7,154,191.


Table 2. Sensitivity of LJM's Portfolio Market Value to Changes in Index Level and VolatilityA figure showing a table demonstrating sensitivity of LJM's portfolio market value to changes in index level and volatility.


If the underlying index fell 5% instantaneously, the option portfolio's market value would fall over $30 million to -$37,597,244 because the market value of its large short put option position would increase far more than the market value of its smaller long put position. Surprising to some perhaps, holding the index level constant and increasing the implied volatility 20% (doubling it from 20% to 40%) would cause this option portfolio's market value to fall $274 million to -$281,470,698. Combining both a 5% decline in the index and a 20% increase in the implied volatility would cause the market value of LJM's October 31, 2017 option portfolio to fall $378 million to ?$385,231,428. That is approximately what happened to the Fund in early February. The losses were larger than what we predict back on the October 31, 2017 holdings suggesting that the Fund increased the riskiness of its holdings between October 31, 2017 and February 4, 2018.

The Fund held short and long put and call options on the S&P 500 futures at four different exercise dates. It is typical in options research to construct a payoff diagram that shows how the option strategy pays off given different levels of the underlying security at expiration. Figure 3 below shows such a payoff diagram. There are four lines - each corresponding to the payoff associated with one of the four expiration dates.


Figure 3. Payoff at Options Expiration for LJMA figure showing a line graph demonstrating payoff at options expiration for LJM.


The strategy for each expiration date is basically the same. The Fund makes a small amount of money if the S&P 500 stays in an approximately 400-point band from 2260 to 2660. If the index closes outside of that band, the Fund can lose a nearly unlimited amount. The band is centered close to the level of the S&P 500 in the fall of 2017, so the band can be thought of as +/- 200 points from the then-current level of the index. The S&P 500 fell 240 points over the fateful week in early February. Note also, that there is very little possibility of growth in this Fund. If the index goes up or down significantly, the Fund loses. It cannot be thought of as a growth strategy. It is a limited income strategy with massive downside risk.

Figure 3, however, only tells part of the story. The drop in the index, while large, was not nearly great enough for the Fund to have incurred an 80% loss. Figure 3 shows the payoffs to the strategy at the expiration date. Option prices prior to the expiration date can be much more volatile and much more prone to wide swings than the price of an option at the expiration date. This is because if we are not yet at expiration, the index has more time to continue to move and push yet-to-expire options deeper into the money.

In order to illustrate how the Fund's strategy performed prior to expiration, we simulated the returns to the Fund for different changes in the market environment. We concentrated on two market environment variables to which option prices are sensitive: the change in the level of the S&P 500, and the implied volatility of the S&P 500. Volatility means how variable the underlying is likely to be over the remaining term of the option. Higher volatility is characterized by large movements up and down of the underlying index. In periods of greater volatility there is a greater probability of a big move in the underlying increasing the value of a long option position (because it becomes more likely that the underlying is going to push through and significantly past the strike price). Since the Fund was net short options, a rise in volatility causes losses to the value of the positions.

Figure 4 below shows the changes in net assets that the LJM Fund would have experienced on October 31, 2017 given various changes in the level of the S&P 500 and in the implied volatility of the S&P 500. The x-axis is changes in the level of the S&P 500. The midpoint of this axis, 100%, represents the point at which there is no change in the level of the index. As you move to the left (right), the index is decreasing (increasing). The y-axis is how much the net assets of the Fund change. The curved colored lines represent different levels of implied volatility. The top curved blue line is the case where the implied volatility does not change. Note that if the index level stays close to 100% (stays level) the net assets of the Fund remain unchanged. For large changes (either up or down) in the index, the net assets of the Fund decrease.

LJM's short strangle strategy profits were highly sensitive to changes in volatility. Increases in volatility would cause large losses even if the S&P 500 Index level was unchanged. A 5% decline in the S&P 500 with no change in volatility would correspond to losses of less than 5%, but when combined with a 20% increase in volatility result in losses of 50% to LJM's October 31, 2017 portfolio.


Figure 4. LJM Fund Sensitivity to Index Levels and Changes in Implied VolatilityA figure showing a line graph demonstrating LJM fund sensitivity to index levels and changes in implied volatility.


As mentioned earlier, the S&P 500 fell approximately 240 points in the first few days of February. This by itself would have caused losses to the Fund. However, of greater import was the increase in the volatility of the S&P 500. The dramatic swings in the index increased the likelihood that the put options the Fund had shorted would move deeply into the money and dramatically increased put prices.

Figures 3 and 4 show exactly what Fund managers knew about the risk of their strategy. It is also what brokers, who recommended the fund, could have easily known simply by looking at the annual report. These figures can be drawn at any time based on the structure of the portfolio and the then-current market environment. It is clear that the gigantic risks that this Fund posed were known and were understood, even as the Fund touted capital preservation and growth, two objectives that could not be met with this strategy. At this writing, it is not clear what actions the Fund managers took in reaction to the market gyrations. However, it seems likely that the Fund sold or was forced to sell out of their options positions. The Fund has not recovered, trading as of this writing at $1.98. This, even as the market has recovered over half of its early February losses and volatility has declined significantly.

Someone should look into this.

A PDF copy of this post for you to email or print is available on our website.

Back