This is why UBS paid the SEC $15 Million over Reverse Convertible Structured Products
Sep 2016
The Securities and Exchange Commission today announced a $15 million settlement with UBS over structured products linked to high volatility stocks today. The SEC press release announcing the settlement and its Order Instituting Proceedings are available on the SEC website. This post explains the underlying notes and why UBS may have paid the SEC a substantial settlement over sales practices related to UBS's reverse convertible notes ("RCNs").
UBS sold thousands of structured notes to retail investors in recent years. Some of those notes, the RCNs, pay a higher coupon than traditional notes but expose investors to the downside risk in single stocks. When an investor buys a reverse convertible note they are selling a put option on the underlying asset and paying the purchase price of the note to fully collateralize the investor's obligation to pay the issuer if the short put option is in the money at maturity. The RCN coupon is partly interest on the collateral the investor posts and partly compensation for the short put option which exposes investors to the underlying asset's downside risk.
UBS has a significant information advantage over retail investors and therefore the risk investors take on when purchasing an RCN from UBS might be significantly higher than they expect and the high coupon they receive not high enough to compensate them for the downside risk. We have published several peer-reviewed papers on the structured notes and posted on www.slcg.com over twenty thousand research report on the retail structured products.
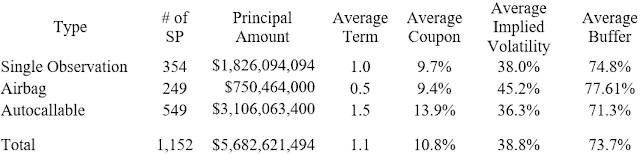
We searched 424B2 filings on SEC's EDGAR for RCNs linked to a single stock issued in 2011 and 2012 and found that UBS Financial Services was the Placement Agent for 1,152 RCNs listed in Table 1, which means UBS Financial Services purchased those RCNs from the issuer in the offering and sold the notes to its clients. The issuers of those RCNs include Barclays, Deutsche Bank, HSBC, JP Morgan, Morgan Stanley, Royal Bank of Canada, and UBS.
Table 1. Reverse Convertible Notes Sold by UBS Financial Services in 2011 and 2012
A. RCN Description
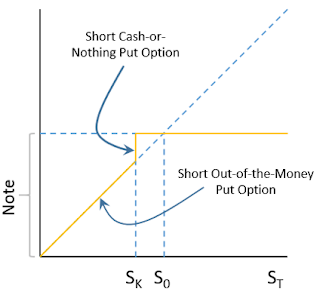
A single observation reverse convertible note ("SO RCN") can be valued as a combination of a note from the issuer, a short European out-of-the-money cash-or-nothing binary put option, and a short European out-of-the-money put option on the underlying stock.
Figure 1. The Final Payoff of the SO RCNs.
For example, UBS trigger yield optimization notes linked to the common stock of Halliburton Company issued in January 2011 is a single observation reverse convertible.1 The 1-year notes pay monthly coupon at an annualized rate of 10.53%. At maturity, the notes pay the market value of one share of Halliburton Company's common stock if the stock price falls below 80% of the initial level at the final observation date. In this case, the investors suffer a loss of more than 20%. Otherwise, the notes pay back the principal.
The Halliburton-linked structured product payoff is the same as receiving the $39.23 face value of the note less $7.85 if the stock closes below $31.38 on the valuation date (this is the payoff to 7.85 short cash-or-nothing put options with a strike price of $31.38), less the amount if any Halliburton closes below $31.38 (this is the payoff to a short put option with a strike price of $31.38).
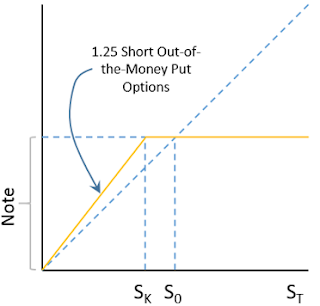
An airbag single observation reverse convertible note ("Airbag RCN") can be valued as a combination of a note from the issuer, and some short European out-of-the-money put options on the underlying stock. The number of the options equals the ratio of the current underlying price and the strike price of the put option. For example, if the strike price is 80% of the initial index level, then the ratio 1.25 is the share number of the put option.
Figure 2. The final payoff of the airbag single observation reverse convertible
UBS airbag trigger yield optimization notes linked to Apple Inc. issued in April 2012 is an example of the airbag single observation reverse convertible. The 6-month notes pay monthly coupon at an annualized rate of 7.91%. The maturity payoff of the principal is reduced by the product of 1/0.85 and the losses of the Apple stock beyond the 15% buffer. Otherwise, the notes pay back the full principal.
An autocallable reverse convertible note ("Autocallable RCN") can have maturity payoffs which look like either Figure 1 or Figure 2, paying the face value if the underlying doesn't close below a trigger price. In addition, autocallable RCNs have a call feature allowing the issuer to refund the entire principal early at pre-determined call dates, if the underlying price exceeds the initial level on the call date. Once the notes pre-pays its principal, no further coupons or principal payments will be made.
B. Selection of Stocks with High Implied Volatility
Once the structure of a reverse convertible - single observation, airbag, autocallable - and the term, trigger and coupon are specified the note's fair market value depends on the volatility of the underlying stock. The more volatile the stock, the more likely the stock price is to be below the trigger resulting in losses to the investor. Holding constant the other attributes of the RCN, UBS could benefit at the expense of its retail clients by selecting higher volatility stocks.
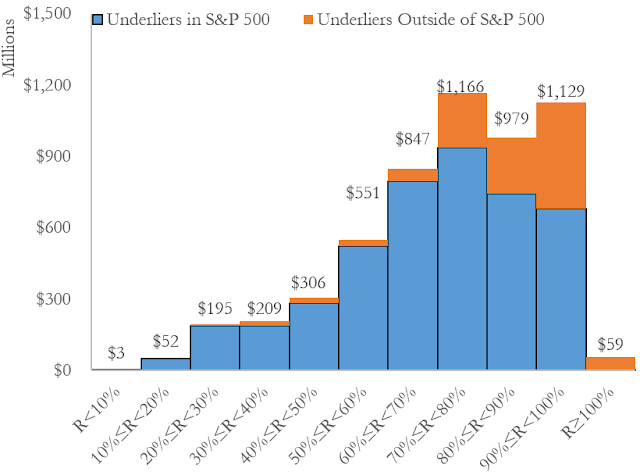
In fact, we find that UBS selects underlying stocks for its RCNs with unusually high volatilities. 73% of the stocks underlying UBS's RCNs were in the S&P 500. 16% are from the additional 2,500 stocks in the Russell 3000 but not in the S&P 500. The remaining underlying stocks appear to be mostly stocks issued by large foreign issuers that would be in the S&P 500 if they were US stocks.
Of the underlying stocks chosen by UBS that were in the S&P 500, 83.7% were in the top half of the distribution of implied volatilities within the S&P 500 when the RCNs were issued. This number increases to 95.6% when we include the underlying that are outside of the S&P 500. This is extremely strong evidence that UBS was selecting unusually volatile stocks from the pool of stocks and that this harmed investors.
Figure 3 is a histogram of the market value of UBS's RCNs issued in 2011 and 2012 sorted by the distribution of volatilities in the S&P 500 at the time UBS issued the notes. If UBS was not purposely selecting underlying stocks with high volatilities, the histogram would be flat with each vertical bar representing 10% of the market capitalization of the RCNs issued. Instead the distribution is skewed sharply towards the higher volatilities found in S&P 500 stocks.
Figure 3. Most of UBS's RCNs Linked to S&P 500 Stocks, Mostly More Volatile
C. What the Implied Volatility Tells You
The information of the implied volatility is useful for investors. When the investors purchased RCNs, what matters is the uncertainty surrounding the future value of the underlying stock. The best estimate of this uncertainty is likely to be the volatility implied by option prices although it could be the consensus volatility forecasts of dealers (they should be the same). In any case, that there is some variation in dealers' forecasts is irrelevant to determining the best estimate of future volatility.
Although the implied volatilities historically overestimate realized volatility, this difference between implied volatilities and realized volatility seems to be related to the non-normality of returns and compensation for volatility risk. Both are equally of concern to purchasers of reverse convertibles as they are to direct sellers of options. Thus, that implied volatilities overestimate realized volatility doesn't make them inappropriate for valuing reverse convertibles or assessing the risk of losses upon conversion to stock payoffs.
Knowing the term, underlying stock and threshold of the reverse convertible is insufficient for an investor to develop an opinion of the likelihood that the reverse convertible will convert into the underlying stock. For instance - and directly on point - investors might believe that the underlying stock is about as volatile as the S&P 500 or the Dow Jones Industrial Average levels commonly reported each day. Because this belief would be mistaken, it would cause investors to underestimate the likelihood of the note converting into stock at maturity and overestimate the value of the reverse convertible note.
The only way for investors to develop a good estimate of this likelihood on the issue date is for the investor to know the implied volatility of the stock. The implied volatilities of the S&P 500 stocks which underlie 73% of UBS's reverse convertible issuances were nearly double the contemporaneous S&P 500 implied volatility; reverse convertible investors who intuit the risk of converting to stock by thinking about the volatility of the S&P 500 will be significantly mistaken.