This is Why Merrill Lynch Paid the SEC and FINRA $15 million over Bank of America's VOL Index-linked Structured Products.
Jun 2016
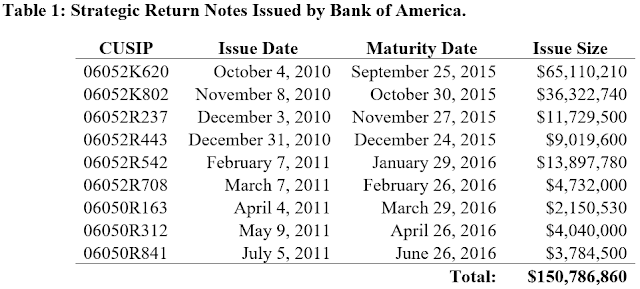
The Securities and Exchange Commission yesterday announced a settlement with Merrill Lynch over structured products linked to Bank of America's proprietary investable volatility index based on VIX Future contracts ("VOL Index"). The SEC press release announcing the settlement and its Order Instituting Proceedings are available on the SEC website. The companion FINRA settlement press releaseand AWC are available on the FINRA website. Bank of America published its VOL Index in 2010 and shortly thereafter issued $150 million of 5-year Strategy Return Notes ("SRNs") linked to the performance of this new index. My coauthors and I have been researching proprietary indexes including but not limited to the VOL Index and will shortly publish our research paper. This blog post summarizes our findings with respect to the VOL Index so readers can better understand Merrill Lynch's settlement with the SEC and FINRA announced today.1
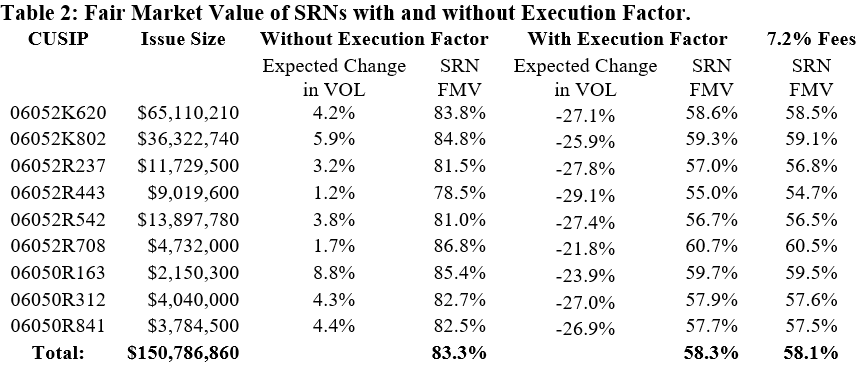
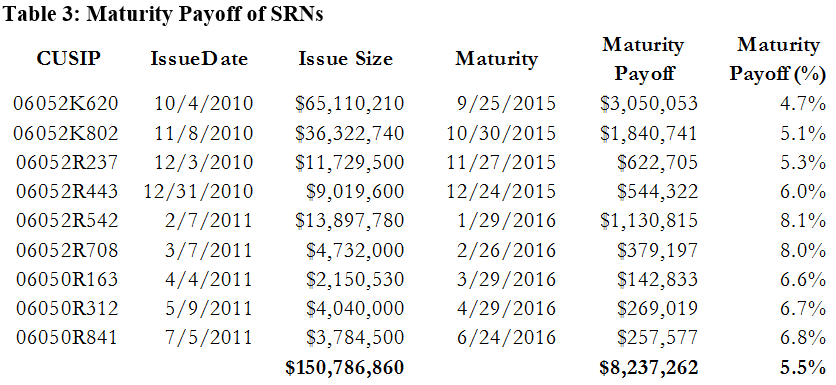
Bank of America clipped the level of the index each day by embedding an Execution Factor and an Index Multiplier in the calculation of the VOL Index. Together these obscure items buried in the calculation of the index operated as an undisclosed 7.2% per annum cost on the structured products linked to the VOL Index that was economically identical but nine times larger than the 0.75% per year Index Adjustment Factor Bank of America disclosed in the offering documents of SRNs. The VOL Index calculated without Bank of America's Execution Factor is highly correlated with the S&P VIX Mid-term Future Index. Since the Execution Factor is equivalent to an additional 7.2% per year cost applied at the SRNs level, investors in Bank of America's s SRNs had the same investment risks but at much higher annual fees and, therefore, much lower net returns with certainty than the Barclays ETN and ProShares ETF which tracks the S&P VIX Mid-term Future Index.The fair market value of Bank of America's structured products linked to the VOL Index averaged at 58.3% of the issue price, the lowest we've seen in over 20,000 structured products we've valued and of the thousands of structured products issued after 2013 that the banks reported its fair market value. These extraordinarily low issue date values are a direct result of the additional undisclosed 7.2% annual index charge built into the index construction rather than the disclosed structured product annual index charge or the economics of the VIX futures market.The maturity payoffs for the nine Bank of America notes have averaged 5.5% or $0.55 per $10.00.
1This blog post and our upcoming research paper on proprietary indexes are based entirely on publicly available information including Bank of America's nine 424b filings for the structured notes linked to the VOL Index and its VOL Index white paper.
I. BOA PUBLISHED VOL INDEX AND ISSUED SRNS LINKED TO THE VOL
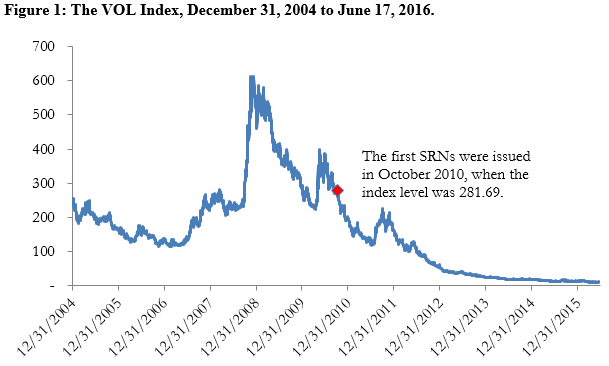
Bank of America first published the VOL Index on March 23, 2010, back-filling the VOL Index levels from an assumed 250 index level on December 31, 2004. Bank of America's first SRN linked to the VOL Index was issued on October 4, 2010. Although the VOL Index is published by CBOE, it appears to have been created by Bank of America solely for the purpose of issuing these Bank of America's SRNs. Unlike the widely referenced S&P's VIX Futures Indexes, we cannot find any structured products, exchange traded products or SEC registered financial products linked to the VOL Index, other than Bank of America's SRNs. We also are not aware of any futures or option contracts written on the VOL Index.
Figure 1 plots the levels of the VOL Index since December 31, 2004. The VOL Index has declined significantly since Bank of America first issued SRNs linked to the VOL Index on October 4, 2010. The redemption prices of those notes at maturity range from 4.6% to 8.2% of the issue price, with an average of 5.5% or $0.55 per $10 note.
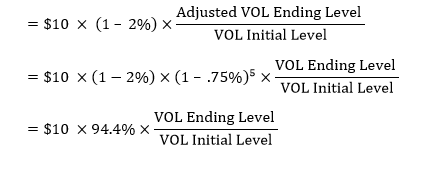
The VOL Index tracks changes in the 3-month implied volatility of the S&P 500 Index three and a half months forward, i.e., for the period from 3.5 months to 6.5 months in the future. Changes in the VOL are highly correlated with changes in the S&P 500 VIX Mid-Term Futures Index, which is based on the prices of fourth, fifth, sixth and seventh-month futures contracts on the VIX, which themselves are a measure of expected future implied volatility. Bank of America issued 5-year SRNs with maturity payoffs reflecting changes in the VOL Index from when each SRN was issued to when each matured reduced by the 0.75% per annum Index Adjustment Factor, and further reduced by a 2% sale charge. Effectively, investors at maturity receive 94.4% of the $10 SRN purchase price increased or decreased by the percentage change in the VOL Index over the term of the note. The payoff at maturity per $10 SRN is:
A. VOL Index Calculation
The VOL Index level is calculated from four CBOE spot VIX calculations based on S&P 500 Index option contracts expiring in the nearest March, June, September, and December denoted as VXMAR, VXJUN, VXSEP, and VXDEC. Those four option contracts are called Index Components. The CBOE calculates VXMAR, VXJUN, VXSEP, and VXDEC in a similar manner to the VIX calculation although the CBOE's weighting of option prices of different expirations in the calculation of the VIX is not necessary since VXMAR is based only on the prices of S&P options expiring on the same day in March, VXJUN is based only on the prices of S&P options expiring on the same day in June, and so on.
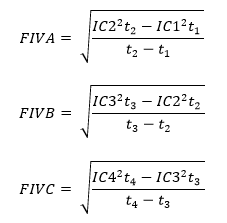
The nearest Index Component is denoted as IC1; second-, third- and fourth-to-nearest Index Components are referred to as IC2, IC3, and IC4, respectively. IC1, IC2, IC3, and IC4 are used to estimate the quarterly Forward Implied Volatility ("FIV") between adjacent Index Components.
The VOL Index level is calculated from four CBOE spot VIX calculations based on S&P 500 Index option contracts expiring in the nearest March, June, September, and December denoted as VXMAR, VXJUN, VXSEP, and VXDEC. Those four option contracts are called Index Components. The CBOE calculates VXMAR, VXJUN, VXSEP, and VXDEC in a similar manner to the VIX calculation although the CBOE's weighting of option prices of different expirations in the calculation of the VIX is not necessary since VXMAR is based only on the prices of S&P options expiring on the same day in March, VXJUN is based only on the prices of S&P options expiring on the same day in June, and so on.The nearest Index Component is denoted as IC1; second-, third- and fourth-to-nearest Index Components are referred to as IC2, IC3, and IC4, respectively. IC1, IC2, IC3, and IC4 are used to estimate the quarterly Forward Implied Volatility ("FIV") between adjacent Index Components.
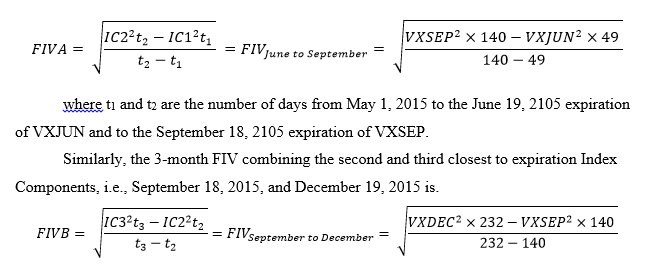
The nearest FIV, denoted as FIVA, is the implied volatility starting from the nearest to expiration of those four Index Components, IC1, to the second-to-nearest to expiration, IC2. Similarly I define FIVB and FIVC as the forward implied volatility starting from the second Index Component, IC2, expiration to the third Index Component, IC3, expiration, and from the third Index Component, IC3, expiration to the fourth Index Component, IC4, expiration.
For example, on May 1, 2015, IC1 is VXJUN expiring June 19, 2015, IC2 is VXSEP expiring on September 18, 2015, IC3 is VXDEC expiring on December 19, 2015, and IC4 is VXMAR expiring on March 18, 2016. The first 3-month FIV, FIVA, which starts from June 19, 2015 is
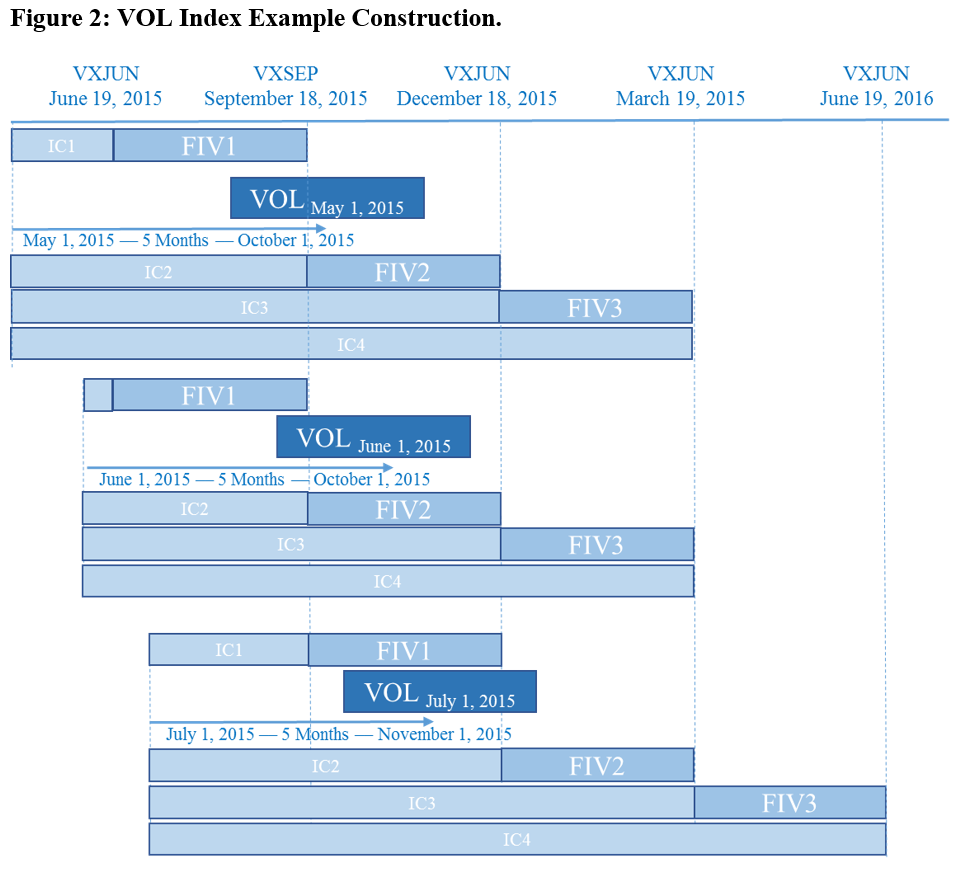
Since the VOL Index measures a 3-month forward implied volatility centered five months in the future (October 1, 2015 in my example), the index calculation uses FIVA and FIVB which are centered before and after the 5-month point. Denote the FIV that is centered right before the 5-month point as FIV1, and the FIV that is centered after as FIV2. In my example, FIV1 is FIVA, the 3-month FIV starting from June 19, 2015, and FIV2 is FIVB, the 3-month FIV starting from September 18, 2015.
As time moves forward the FIV1, FIV2 and FIV3 date ranges remain fixed and the VOL date range moves forward, overlapping for a day with the date range for FIV2. FIV2 then becomes the new FIV1 and FIV2 becomes the new FIV2. See Figure 2.
The FIV1 and FIV2 values fluctuate every day, reflecting the changing levels of the Index Components (VXMAR, VXJUN, VXSEP and VXDEC). The center of the date range covered by VOL remains 5 months in the future so as time passes if the Index Components' values don't change much from one day to the next, the weight on FIV1 is reduced to 0% and the weight on FIV2 is increased to 100%. When the weight on FIV1 drops to 0% and the weight on FIV2 increases to 100%, the old FIV2 becomes the new FIV1 with a weight of 100% and the old FIV3 becomes FIV2 with a weight of 0% and the rolling from FIV1 to FIV2 starts again. The daily return of the synthetic portfolio equals the weighted change in the FIV1 and FIV2 calculations less the impact of the Execution Factor. Setting aside the Execution Factor, the synthetic portfolio is equivalent to investing the dollar value of the synthetic portfolio into the two forward implied volatility contracts according to the weights on FIV1 and FIV2. If the weights are 40% and 60% for FIV1 and FIV2, respectively, then for $100 portfolio $40 is invested in FIV1 and $60 is invested in FIV2. On the next day, the portfolio becomes more or less valuable depending on the changes of the $40 position in FIV1 and $60 position in FIV2. At the end of each day, the synthetic portfolio is rebalanced to reflect the newly calculated portfolio weights which change because of the passage of time. In addition, because of daily changes in the relative value of FIV1 and FIV2 the number of units of FIV1 and FIV2 contracts which should be held to establish the desired portfolio weights changes daily.
Because the Execution Factor is applied to the hypothetical contracts purchased each day as part of the rebalancing, the daily cost fluctuates from zero (in the vanishingly rare instances when no rebalancing occurs) to more than 7 basis points (when the rebalancing required exceeds the average daily rebalancing). Since the entire portfolio value is eventually transferred from the FIV1 contract to the FIV2 contract every quarter, the entire hypothetical portfolio value is subjected to the Execution Factor four times a year. Thus, the Execution Factor of 1.015 embeds a phantom transaction cost of 1.5% per quarter - 6% per year. The daily return of the synthetic portfolio is multiplied by the Index Multiplier 120% and then increased by the 30-day Treasury-bill rate to determine the daily return of the VOL Index. The Index Multiplier magnifies the impact of the Execution Factor by an additional 20% so the phantom trading costs Bank of America incorporates into the VOL Index is 7.20% per year.
B. Execution Factor Complexity is Spurious, Impact is Certain
The Execution Factor and the Index Multiplier reduce the index level by 7.2% per year on a daily basis while there are no transaction costs in the calculation of the S&P VIX futures indexes referenced by other firms' ETPs. These other ETP issuers disclose an annual deduction from the S&P VIX futures indexes of 0.85% and 0.89%. Bank of America was in fact deducting 7.9% per year from the levels implied by changes in forward implied volatility but only disclosing 0.75%, when the remaining 7.2% is equally certain and amenable to clear, simple quantitative disclosure.
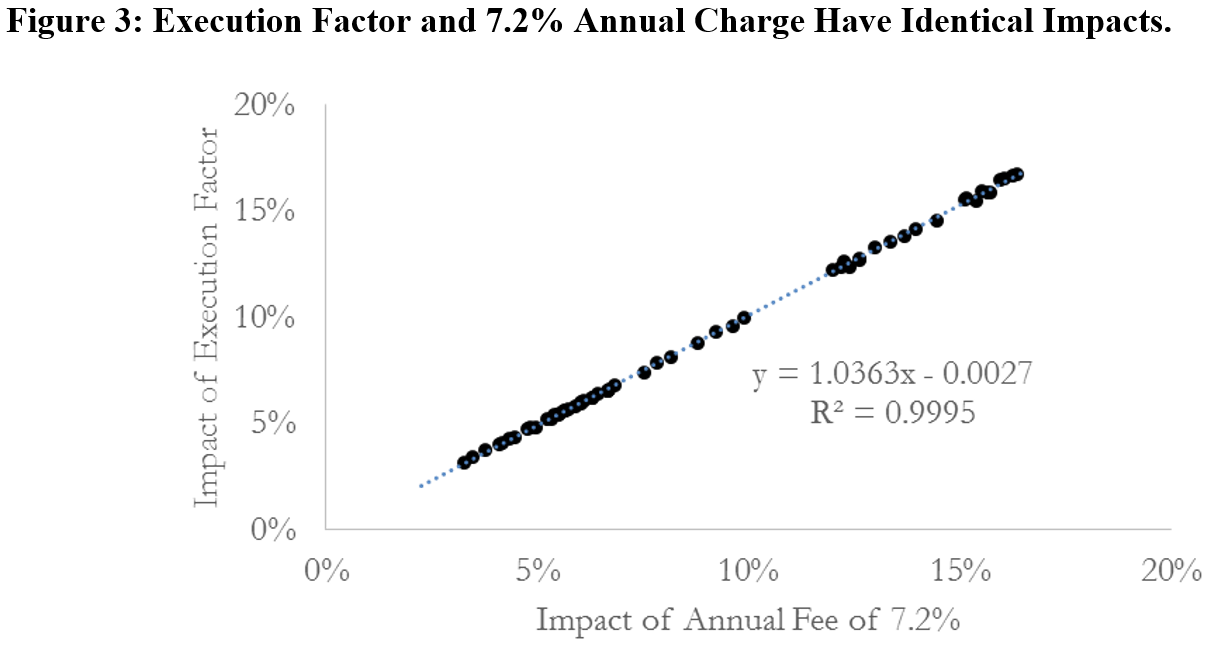
If instead of applying the Execution Factor, we assume that Bank of America deducts a 7.2% annual index charge daily. We generate a set of impacts on the VOL Index which are virtually identical to the Execution Factor's impact. In Figure 3, I plot the impact of the Execution Factor against the impact of a 7.2% annualized deduction from the index and draw a regression line through the data. The effective annual cost of the Execution Factor and the 7.2% fixed fee are highly correlated with an R-squared value 0.9995. If I extend the data period from before October 2010 to July 31, 2015, the R-squared is 0.9993. It is clear that the complex method by which the Execution Factor is included in the index calculation has no substance; the extraordinarily complex Execution Factor is simply a 7.2% annual deduction from the unencumbered index implemented by Bank of America in a dense fog.
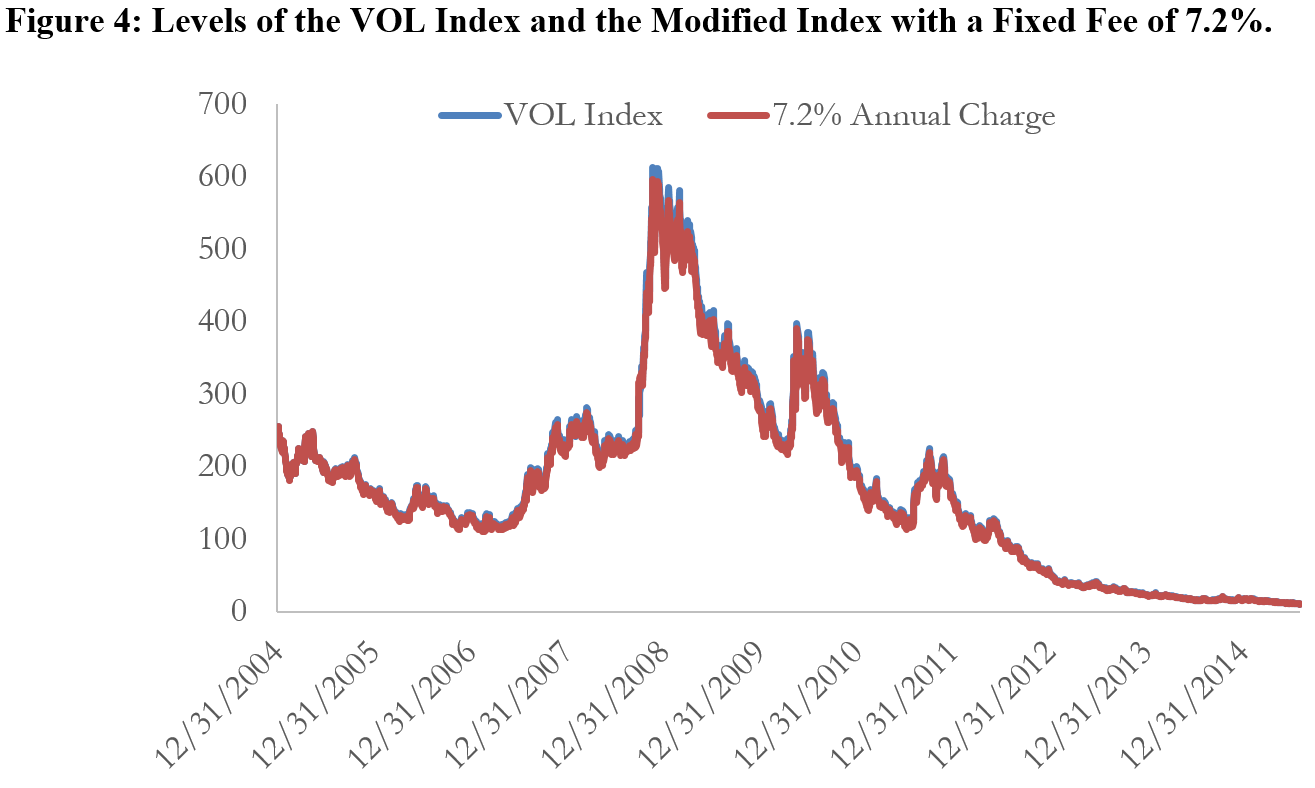
We also plot the VOL Index and the VOL Index without the Execution Factor but with a fixed fee of 7.2% in Figure 4. Using 10 years of data, the difference of both curves is trivial. As of July 31, 2015, the VOL Index level is 11.39, and the index level with 7.2% fee is 11.20 - a difference of only 0.1% of the initial index level of 250 after 10 years of daily calculations.
Again, the substance of the Execution Factor is simple: it is a 7.2% annual index charge applied during the construction of the index. It could have been disclosed as such or eliminated and a 7.9% index charge applied and disclosed at the SRN level.
From 2009 to 2011, several financial institutions, including Barclays, VelocityShares, UBS, and ProShares issued various ETPs to track the return of the S&P's VIX Futures Indexes with annual fees charges ranging from 0.85% to 1.35%. These charges plus the difference between the issuers' cost of debt and the 91-day Treasury yield S&P includes in its indexes provides gross margin to cover any hedging costs and reasonable profits. Since Bank of America applies 30-day Treasury rates, which are approximately 10 basis points less than the 91-day Treasury rates used by S&P, in the construction of the VOL, it would have the same gross margin as other VIX-related issuers to cover hedging costs and earn a reasonable profit without the additional 7.2% per year it takes from SRN investors via the Execution Factor applied in the VOL calculation.
II. STRATEGIC RETURN NOTES
A. Fair Market Value of SRN
Researchers have introduced several dynamic time models for simultaneously modeling the S&P 500 index's levels and instantaneous variances. For a few representative examples, see (Lin Y.-H., 2007) (Lin & Chang, Consistent Modeling of S&P 500 and VIX Derivatives, 2010) (Lin & Chang, VIX Option Pricing, 2009) (Zhu & Lian, 2012). 2 All the models assume the stock prices follow a log-normal process and the instantaneous variances follow a mean reverting process, and those two processes are negatively correlated. Jump terms could be added to the stock prices or the variance levels to make them jumped based models.
Table 2 reports the fair market value of the SRNs in the second to last column. The SRNs were worth, on average, around $87,942,502 million or 58.3 cents per dollar when issued. In the last column, we calculate the fair market values of the SRNs, assuming that the VOL Index is calculated without the Execution Factor, but with a fixed daily cost of 7.2% per annum. These low values are largely a result of the additional annual index charge Bank of America embeds in the VOL Index. Bank of America reduces the future levels of the VOL Index by applying additional annual index charge through the Execution Factor and Index Multiplier. The The expected level of the VOL Index at maturity is substantially lower than the VOL level on the issuance date.
The SRNs would have been worth $125,670,891 or 83.3 cents per dollar if the VOL Index had been calculated without an Execution Factor. Table 3 reports the maturity payoffs of the SRN, the last of which matures this week. The average maturity payoff of the Bank of America notes (which didn't pay interest coupons) was 5.5% or $0.55 per $10.00.
_______________________________________
2Details see J. Zhang, J. Shu, and M. Brenner, "The New Market For Volatility Trading", The Journal of Futures Markets, Vol. 30, No. 9, 809-833 (2010)