The Recent Market Turmoil Spells Trouble for "Auto-liquidators" like Interactive Brokers
Aug 2015
Interactive Brokers Group, Inc. (IB) caters to active traders including those who trade futures and options. These active traders' accounts typically are subject to "portfolio margin" requirements which we have written about at length. 1 IB requires its customers to agree to have IB auto-liquidate positions when accounts are in a margin deficit.
IB's auto-liquidation procedures were the focus of a FINRA arbitration earlier this year in which the Claimant, Glen Lyon Long-Term Options, LP, alleged that IB did not liquidate positions to meet a margin deficit in a commercially reasonable manner, in part by closing positions at prices which were outside the National Best Bid or Offer (NBBO). 2
Monday's sharp market drop may have caused hundreds of accounts at auto-liquidating firms like IB to be severely damaged by faulty auto-liquidation algorithms. Poorly designed algorithms can execute trades that have no hope of efficiently alleviating a margin deficit and actually can convert a curable margin deficit into a death spiral liquidation.
Such harm may have been caused to hundreds of accounts late last week and early this week. I provide an actual example involving deep out of the money put options but these accounts saw their equity drop, perhaps to a debit balance, as a result of bad trades in thinly traded stock and stock index options.
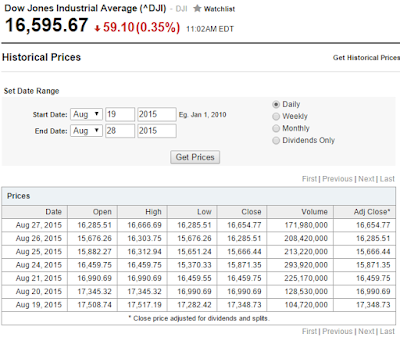
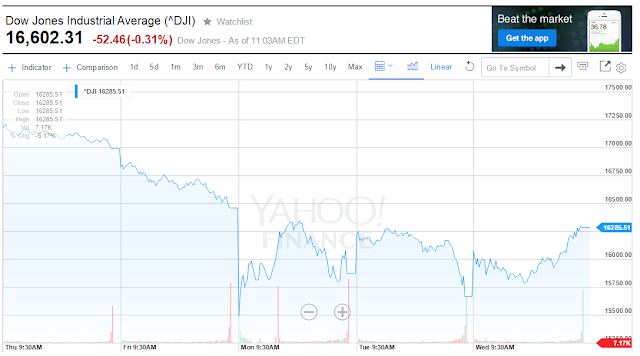
Last week the Dow Jones Industrial Average dropped 531 points (-3.12%) Thursday, 588 points (-3.57%) Friday and 1,089 points before rebounding to close down 205 points (-1.29%) on Monday this week. See Table 1 and Figure 1.
Table 1. Yahoo Recent Historical Dow Jones Index Values
Figure 1. Yahoo Recent Historical Dow Jones Index Values
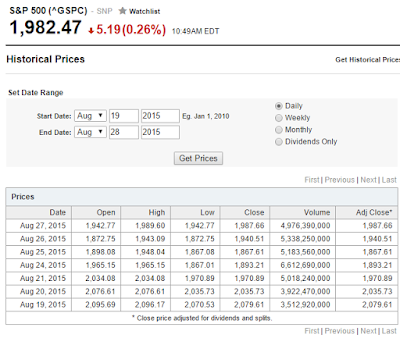
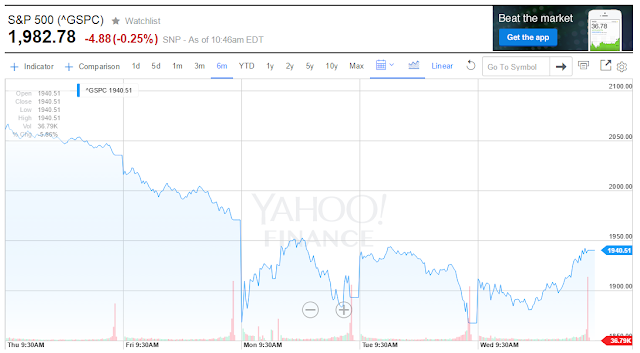
The 8.5% drop from Wednesday's 17,348.73 close to Monday's 15,871.35 was slightly exceeded by an 8.9% drop over the same three days in the S&P 500 Index. See Table 2 and Figure 2.
Table 2. Yahoo Recent Historical S&P 500 Index Values
Figure 2. Yahoo Recent Historical S&P 500 Index Values
Auto-liquidation algorithms fail when they liquidate thinly traded positions with large bid ask spreads. The margin deficit is calculated based in part on values at or inside the bid ask spread. If the liquidating trades are executed at prices equal to the prices used to value the portfolio the customers' equity remains the same, the margin requirement is lowered and the deficiency is reduced.
Poorly designed algorithms may execute trades at or above the "bid" when closing a short position and at or below the "ask" when closing a long position. When this happens, the customer's equity is reduced by the liquidating trades which may worsen rather than improve the margin deficiency. Some of these accounts will be converted from an equity position to a debit position in milliseconds because of the faulty algorithm without any change in the value of the portfolio holdings.
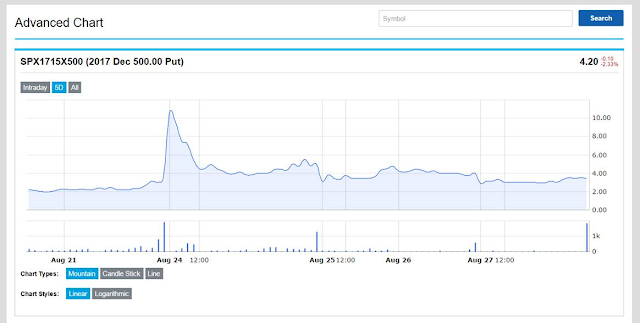
Figure 3 is a screen shot from the CBOE website for December 2017 SPX put options with a strike price of 500. The value of these thinly traded put options are not very sensitive to a decline in the S&P 500 because are far, far out of the money since the S&P is around 2,000 and don't expire for almost two and a half years.
Figure 3. CBOE December 2015 500 Put Prices
The spike up in prices on Monday morning are from a small number of trades which appear to be far outside the NBBO. The options had been worth about $2 in the days preceding the drop and around $4 since. The S&P 500 is between 5% and 10% less when the options are worth $4 than it was when the options were worth $2. The lowest level of the S&P 500 on Monday morning is about 5% less than the average we observed the rest of the week when the options traded for $4. This strongly suggests that the put options were worth at most $5 or $6 on Monday morning at the absolute bottom of the market drop.
In one IB account, we observe 43 trades above $7, 11 at $10 or higher including a trade at $16 and a trade at $83. These trades were not commercially reasonable and quickly turned a credit balance into a debit balance.
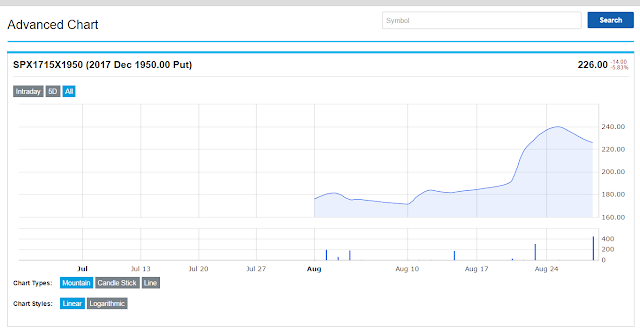
Higher volatility Monday morning does not explain the $10 prices on the December 2017 500 puts. Figure 4 is a CBOE screenshot for the December 2017 1950 puts. The increase we see from between $180 and $200 before the market decline to between $220 and $240 after the market decline is consistent with the drop in the underlying index level without any dramatic increase in implied volatility.