Jason Voss at the CFA Institute has recently written a very interesting series of posts on the Hurst exponent, which is "a method for detecting persistence, randomness, or mean reversion in financial markets." The Hurst exponent measures the degree to which a signal depends on previous values--a phenomenon known as autocorrelation--and specifically whether values tend to 'switch' (e.g., high values followed by low values) or 'persist' (e.g., high values followed by other high values). Jason discusses the interesting history of this metric and walks step-by-step through calculating a Hurst exponent for the daily returns of the S&P 500 since 1950.
A Hurst exponent of between zero and 0.5 suggests a 'switching' signal, whereas a value between 0.5 and one suggests a persistent signal (a fully random signal has a Hurst exponent of 0.5). Jason calculates that the daily returns of the S&P 500 since 1950 are characteristic of a random signal.
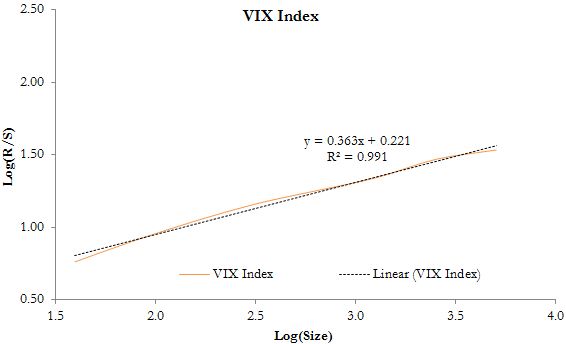
We thought this was pretty darn interesting. Specifically, we wondered what the Hurst exponent might be for signals that are often considered mean reverting, such as the CBOE Volatility Index, known as the VIX. Mean reversion has been extensivelystudied in the context of the VIX, even in the academic literature. So what does the Hurst exponent method have to say about the VIX?
We have applied the methodology of Andrew Lo and Craig MacKinlay's book "A Non-Random Walk Down Wall Street," available online in its entirely at Princeton University Press. Specifically, we apply the non-modified rescaled range analysis in chapter 6, section 3 to the VIX between January 29, 1993 and March 1, 2013. We chose this start date so that we could compare the results to both the S&P 500 (SPX) and the SPDR S&P 500 ETF Trust (SPY)over the same time period.
The Hurst exponent of the VIX (the beta of the linear regression shown below) is approximately 0.36 suggesting a switching signal.
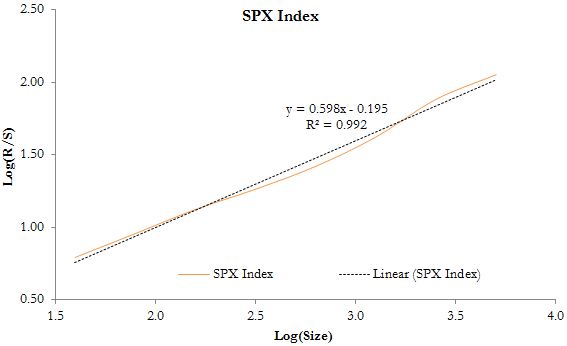
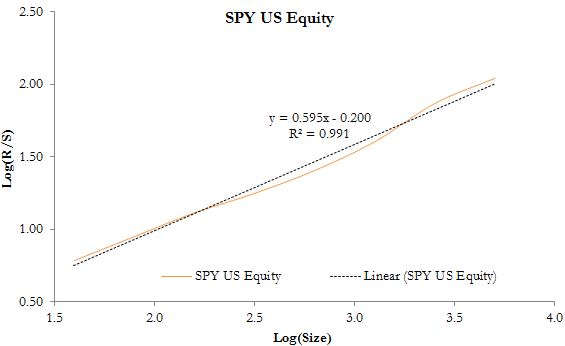
Both the S&P 500 and the ETF tracking the S&P 500 have a Hurst exponent of about 0.6 suggesting a much more persistent signal than the VIX calculation above. Here is the result for the S&P 500:
and for the SPDR S&P 500 ETF Trust:
Jason obtained a Hurst exponent of 0.49 for the period of January 3, 1950 through November 15, 2012 indicated basically a random signal. We reproduced his analysis and found a result of 0.478 using log returns and 0.482 using arithmetic returns (as Jason does). Our measured Hurst exponents over the period 1993 to 2013 are indicative of a slightly more persistent signal.
Consistent with expectations, the VIX fell squarely within the "long-term switching" regime by this metric while the S&P 500 and SPY have shown characteristics of a weakly persistent signal in the last twenty years. It would be interesting to see how the Hurst exponent changes as more data becomes available for the VIX and volatility-related ETFs.