Hedge Fund Correlation with Broad-Based Indexes Increases Dramatically
Mar 2012
As Bank of America-Merrill Lynch Global Research's Mary Ann Bartels showed last year, the correlation of hedge fund monthly returns with broad based stock market indexes has recently hit historic highs. We decided to look into this phenomenon and determine whether or not it is persisting.
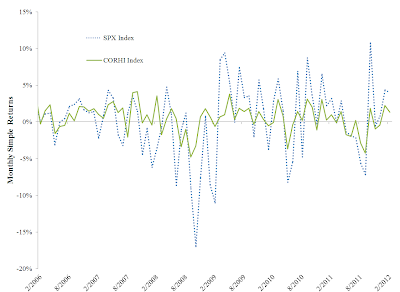
This figure indicates that the volatility of hedge fund returns is smaller than the volatility of broad-based index returns; however, this result is misleading for several reasons. Since the CORHI Index represents an aggregation across hedge fund strategies, the idiosyncratic characteristics of individual hedge funds are lost in the analysis. Furthermore, hedge funds self-report their returns. This leads to artificially low-volatility since hedge funds are able to smooth reported returns over several months (resulting from a phenomenon known in the literature as "stale prices"). A related reason for the observed low volatility of returns could be the so-called "incubation bias". As a hedge fund begins to report returns, the presentation of historical returns might not be precisely reported (again leading to a smoothing of returns).
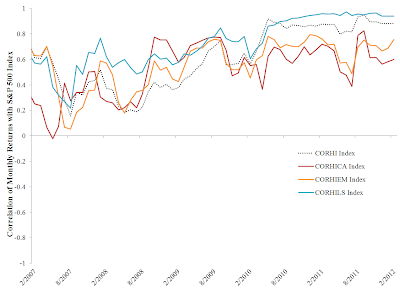
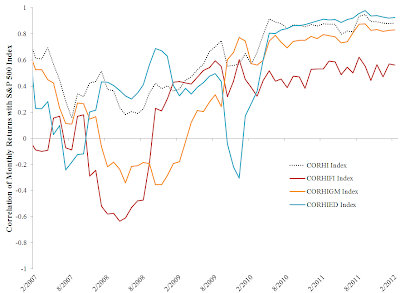
These two figures indicate several interesting characteristics about hedge fund strategies. Firstly, almost all hedge fund strategies currently exhibit a large (>0.5) positive correlation and have been exhibiting this level of correlation for the better part of the past two years. This high degree of positive correlation indicates that the diversification benefits of hedge fund investing, at least when aggregated across several hedge funds within the same strategy, are limited in our current climate. Secondly, the degree of correlation with the S&P 500 has remained relatively stable for several of the strategies over time. Third, different hedge fund strategies have historically behaved quite differently when compared to broad-based indexes, but recently all hedge fund strategies seem very closely tied to the behavior of the overall hedge fund index in terms of the correlation with the broad market (CORHI Index).
We hope, in future blog posts, to address the returns exhibited by the hedge fund industry at a more micro-level; however, this post will hopefully give our readers an introduction to the general trend in the hedge fund industry.