You can download a copy of this note to print or email here.
Introduction
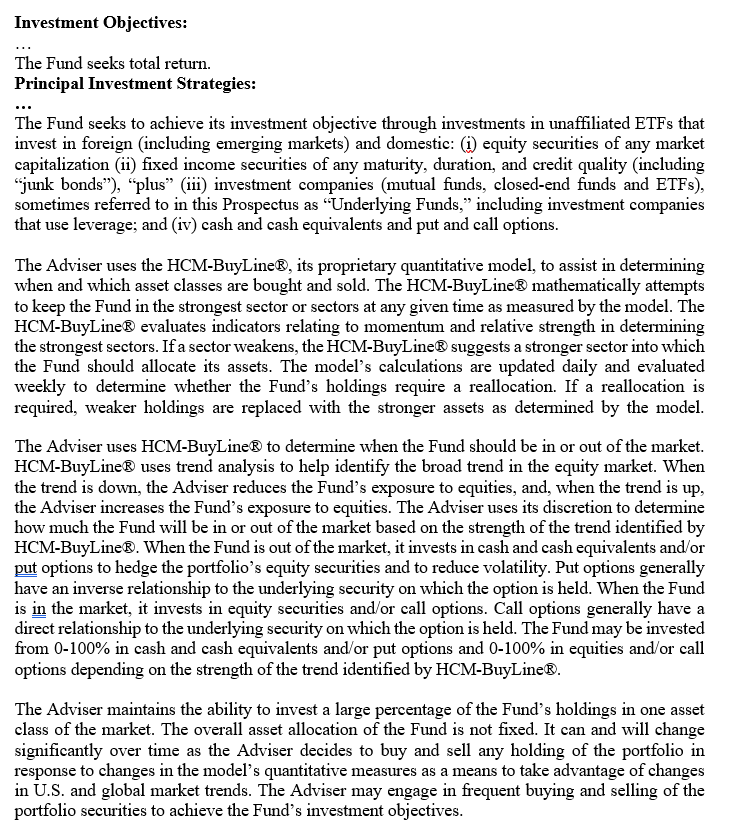
Howard Capital Management ("HCM") is a SEC-registered RIA based in Roswell, GA.[1] In addition to advising individual accounts,
it manages mutual funds and ETFs. It claims to use proprietary technical analysis, HCM-BuyLine(R), to market-time the funds' asset allocations.
Without any risk disclosure, HCM's mutual funds buy and hold leveraged ETFs for much longer periods than is widely recognized to be appropriate.
We provide some summary information of the HCM funds and examples of lengthy leveraged ETF holding periods.
Howard Capital Management (HCM) manages $4 billion in net assets in 4 mutual funds and 3 ETFs. In addition, HCM manages individual accounts.
HCM claims to use technical analysis to allocate portfolio assets to stocks and cash.
HCM uses leveraged ETFs for a significant portion of its equity exposure.
HCM inappropriately holds leveraged ETFs for at least 6 months and perhaps as long as two years. This conduct goes back to 2015 but appears to have gotten much worse since 2020.
HCM does not disclose the Holding Period Risk or rebalancing risk which is an emphasized principal risk disclosed by the issuers of the leveraged ETFs which dominate HCM's fund portfolios.
1. Leveraged ETFs
Leveraged ETFs produce returns equal to multiples (2X and 3X and -1X, -2X and -3X for inverse ETFs) of broad stock market indexes' returns on a daily basis.
Leveraged and inverse ETFs rebalance their derivative holdings after the close each trading day to reset their leveraged or short exposure to their target multiple.
As a result of this daily rebalancing, the long-term returns from holding a leveraged or inverse ETF can differ significantly - and with a strong negative bias -
from holding a leveraged or short position in the underlying index in a margin account.
Ten years ago, we contributed three papers to the significant literature on the returns to holding leveraged and inverse ETFs. [2]
Issuers identify the impact of daily portfolio rebalancing on the returns to holding leveraged and inverse ETFs for longer than a day as a key risk.
For example, ProShares issues three significant HCM holdings - Ultra QQQ, Ultra S&P 500 and Ultra Technology. Each are 3X leveraged ETFs.
The October 1, 2023 Prospectus sections for these three funds is attached as Appendix 1. ProShares lists "Holding Period Risk" second in the section
"Principal Risks" and devotes 40% of the section to Holding Period Risk - 8 times as much space as it devotes to Leverage Risk.
HCM, on the other hand, doesn't mention Holding Period Risk or daily rebalancing risk in its Prospectuses, annual reports or semi-annual reports despite
leveraged ETFs making up approximately 50% of its portfolio holdings. Not only do HCM funds contain substantial holdings of leveraged ETFs,
the HCM Funds maintain large untraded positions for at least six months.
The Securities and Exchange Commission, FINRA and state securities regulators have repeatedly identified length of holding period and daily rebalancing as
significant risks in leveraged and inverse ETFs. See for example, FINRA Notice 09-31, FINRA Reminds Firms of Sales Practice Obligations Relating to Leveraged
and Inverse Exchange-Traded Funds www.finra.org/rules-guidance/notices/09-31.
The SEC has charged brokers and advisors with investing clients in leveraged and inverse ETFs and holding the LETFs for longer than days or weeks.
States have also barred advisors for investing clients' money in buy and hold strategies using leveraged and inverse ETFs.
In the Matter of Timothy Fife, Case No. 14-028, Before the Ohio Department of Commerce, Division of Securities.[3]
In the Matter of Nicholas Rowe, Focus Capital Wealth Management, State of New Hampshire, Bureau of Securities Regulation.[4]
Coincidentally, Craig was involved as the expert witness on leveraged and inverse ETFs for the state in both cases. Also, in both cases, the Advisors falsely claimed that
because they were using technical analysis to evaluate when to buy and sell leveraged ETFs, the strong caution against holding leveraged ETFs for more than days or weeks did not apply to them.
2. HCM Funds
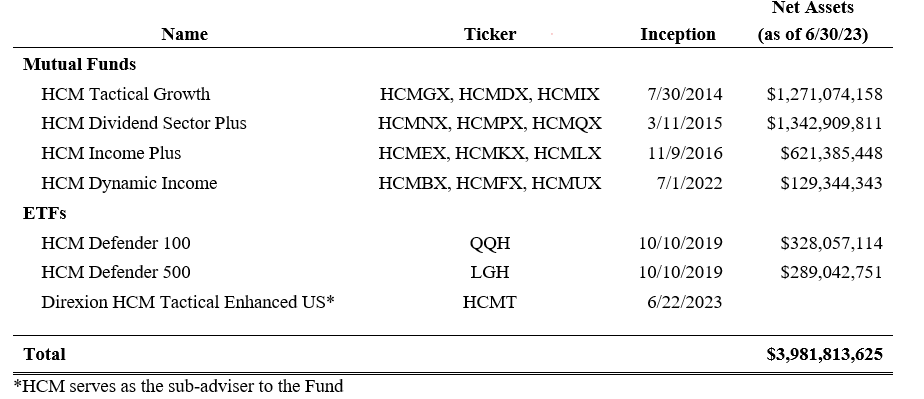
HCM advises four mutual funds and three ETFs with $4 billion in net assets as of June 30, 2023:
Table 1 HCM Funds
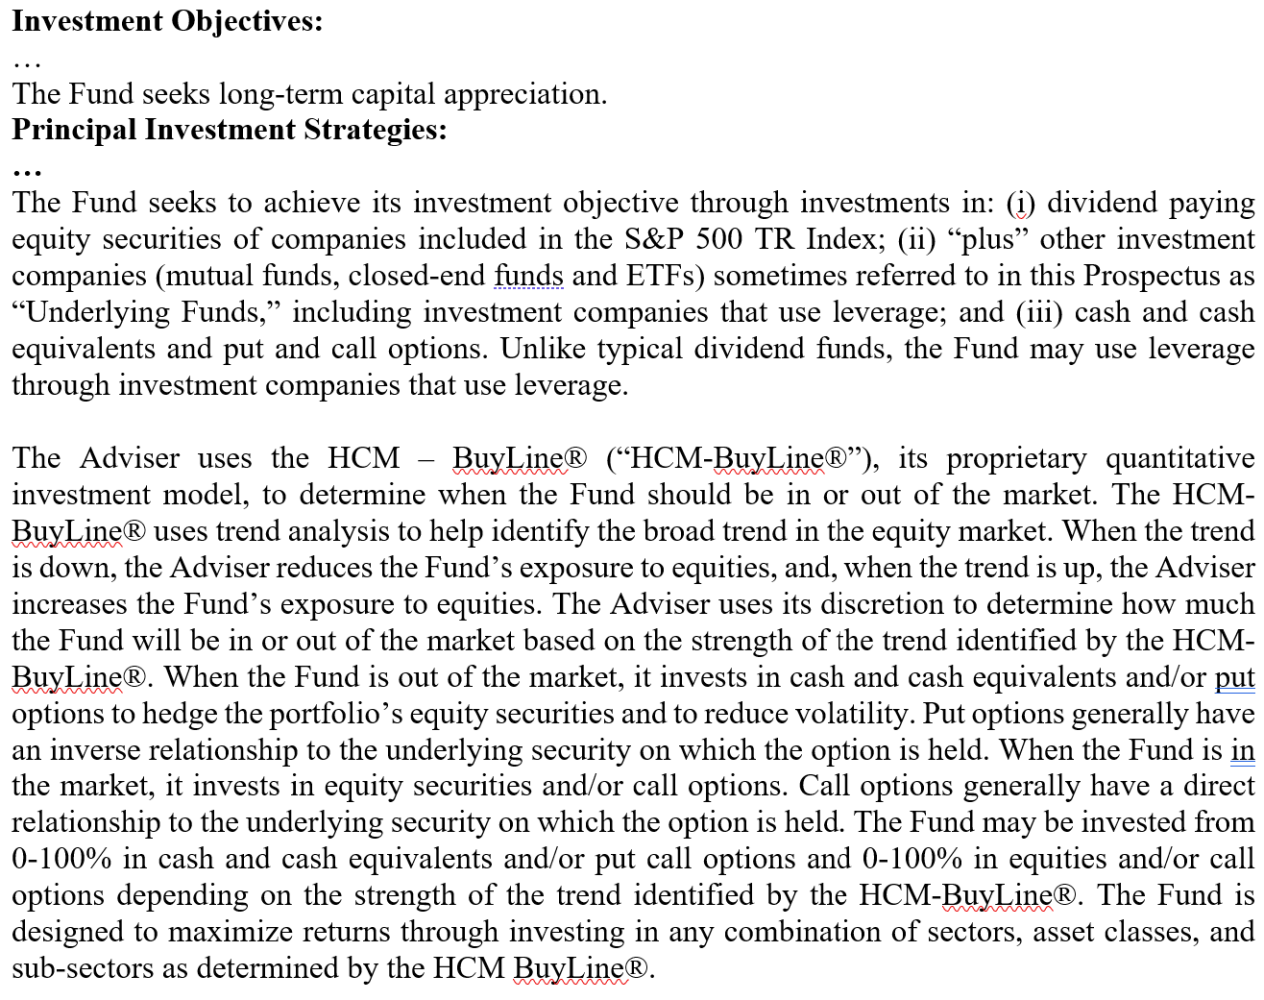
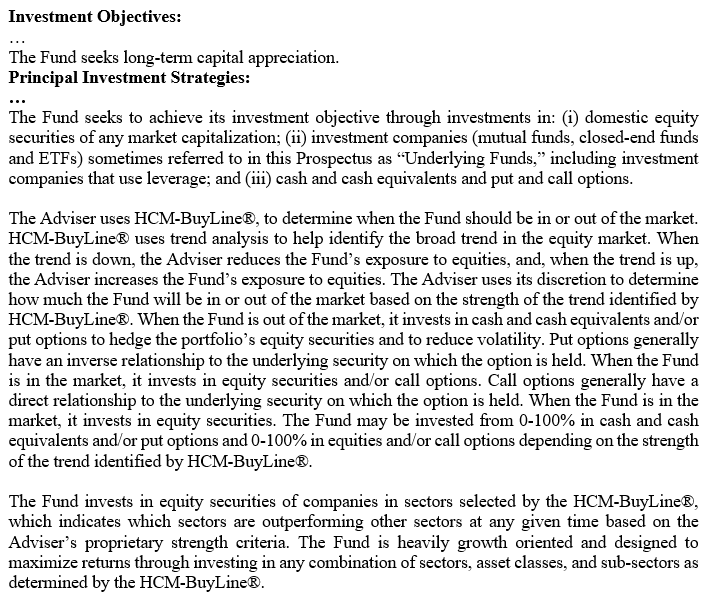
a. HCM Dividend Sector Plus
From the November 1, 2023 Prospectus[5]:
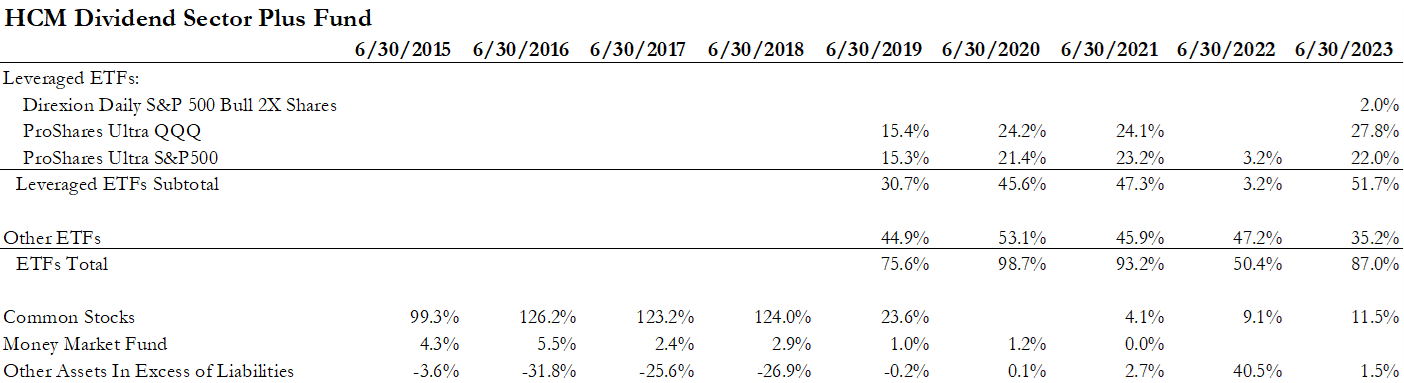
At year end June 30, 2022, HCM Dividend Sector Plus Fund held 40% in cash. Otherwise at each year end from 2015 to 2023, it was fully invested in equities.
Initially this fund invested in individual common stocks but starting in the 2019 Fiscal Year purchased ETFs instead of individual stocks. See Table 2.
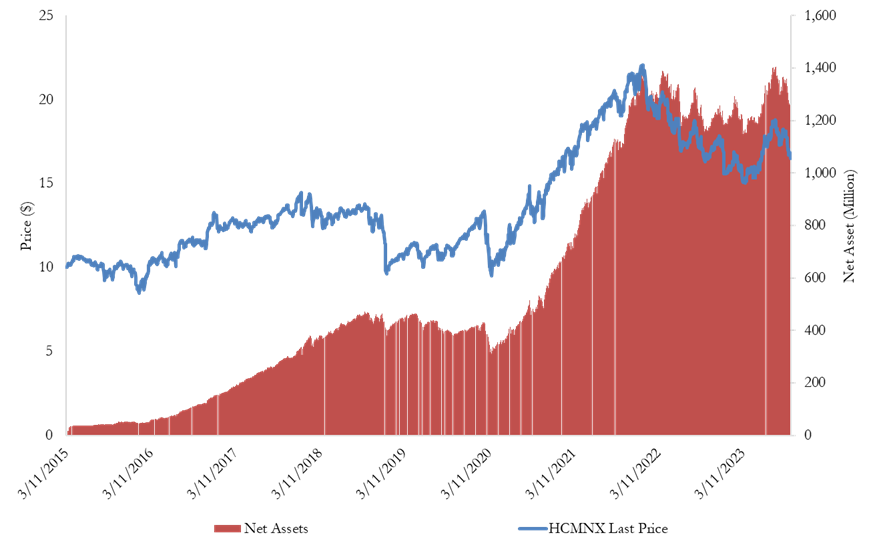
Figure 1 plots HCM Dividend Sector Plus Fund's NAV and Net Assets from inception to the present.
Figure 1 HCM Dividend Sector Plus Fund's NAV and Net Assets
Howard Capital Management charged Dividend Sector Plus Fund investors $86,356,777 including $56,005,858 in advisory fees since 2015.
$43,736,510 or one-half of those fees have been charged in the past two years. See Table 3.
Table 3 HCM Dividend Sector Plus Fund Advisory Fees and Expenses Total $86 million.
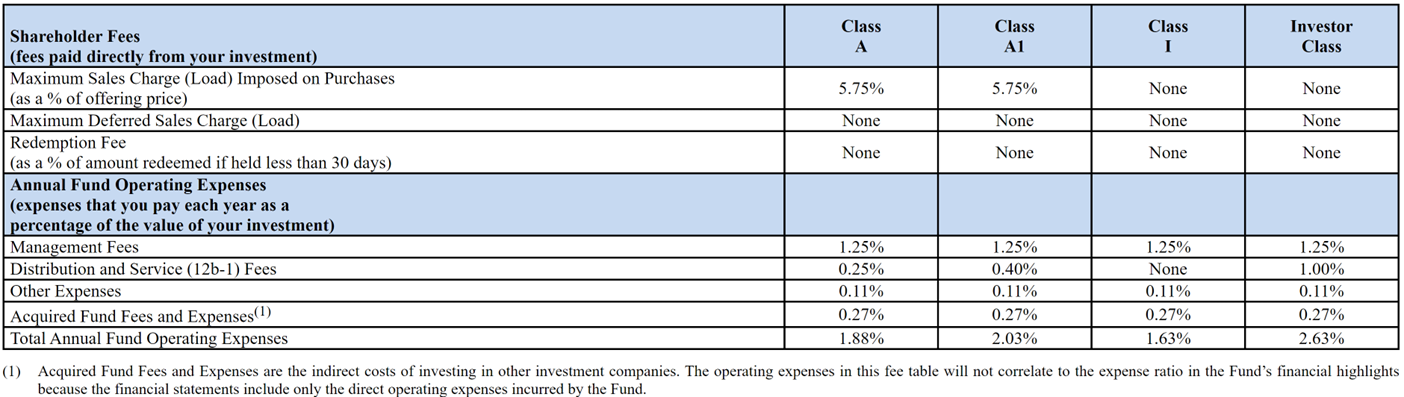
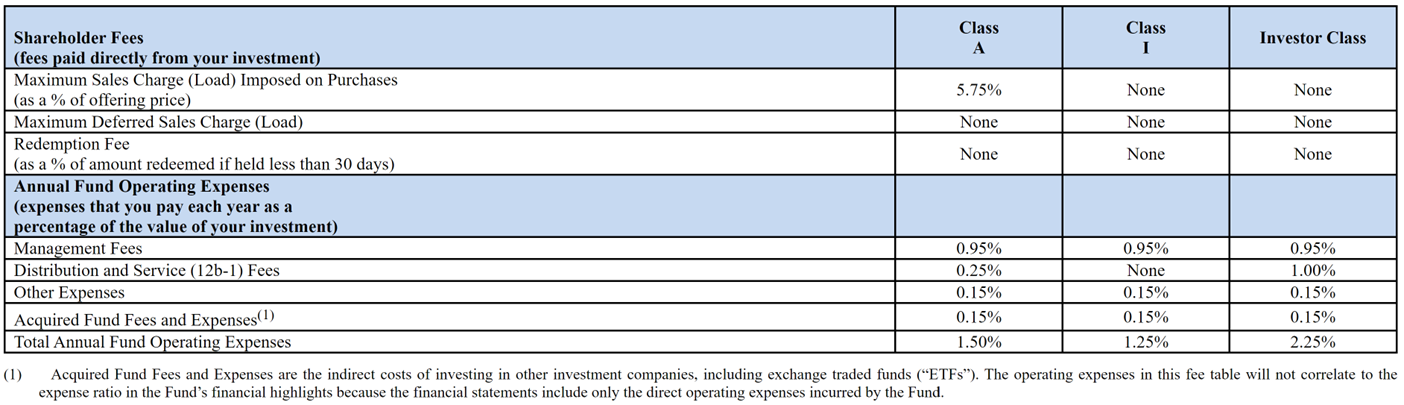
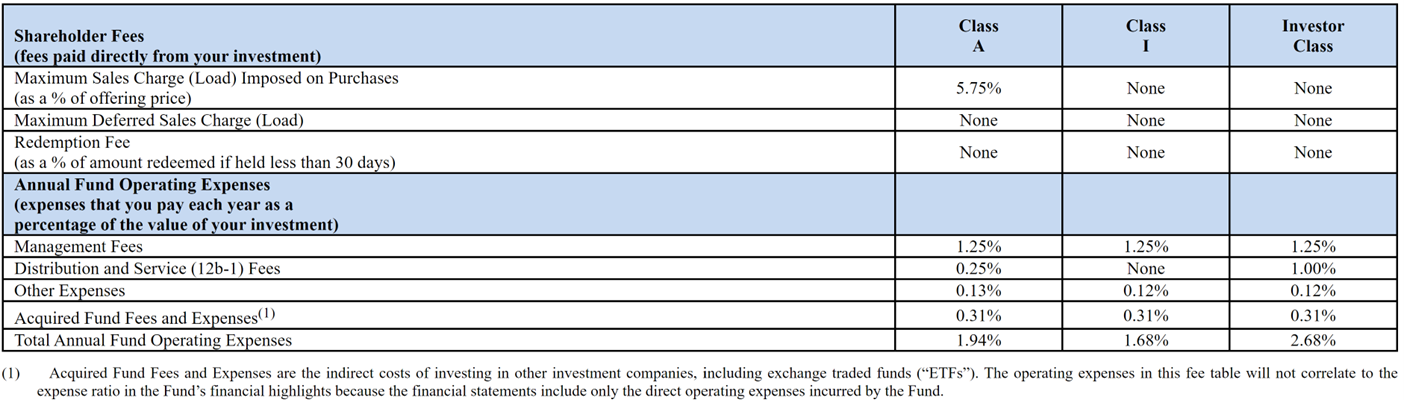
Table 4 excerpts Dividend Sector Plus Fund's expense table for the November 1, 2023 Prospectus. HCM mutual funds are high-cost, broker-sold funds.
74% of HCM's four mutual fund outstanding shares are Class A shares which carry a 5.75% up front sales load and 24% are Investor Class shares which have an annual 1% 12b-1 fee.
Table 4 HCM Dividend Sector Plus Fund Expense Table.[6]
b. HCM Income Plus Fund
From the November 1, 2023 Prospectus[7]:
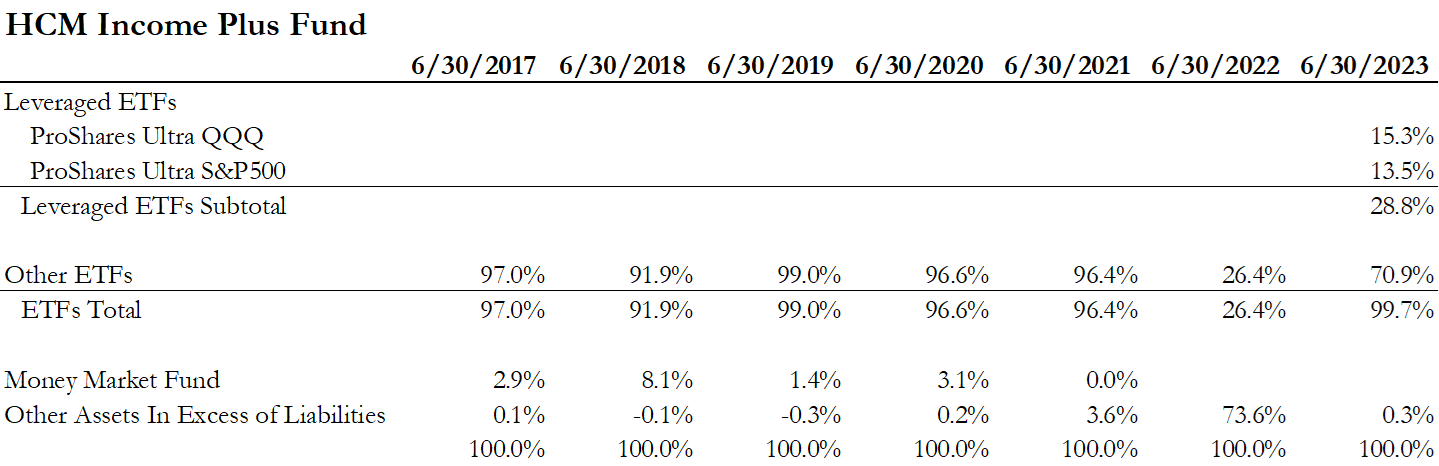
HCM Income Plus didn't hold leveraged ETFs at any year end until June 30, 2023. See Table 5.
Table 5 HCM Income Plus Fund's Annual Portfolio Holdings Summary
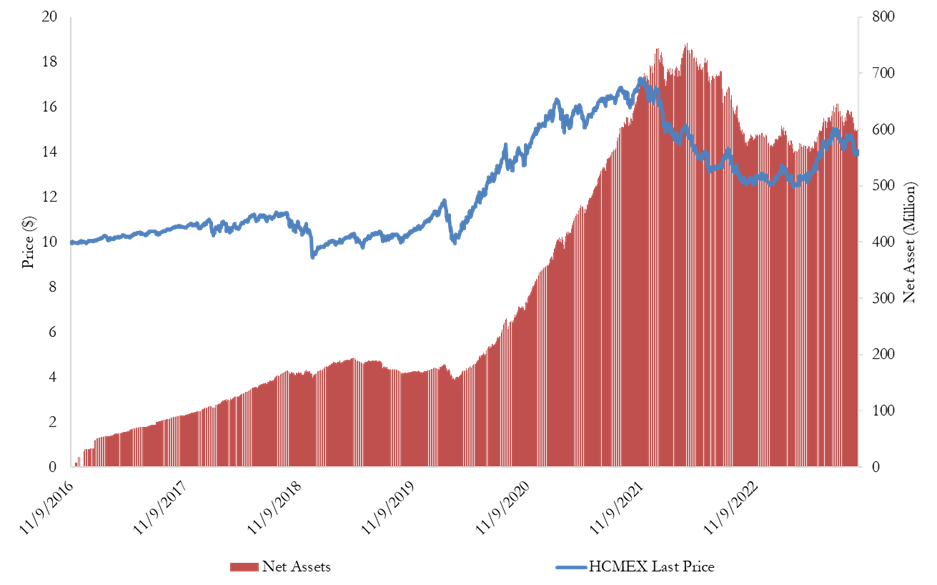
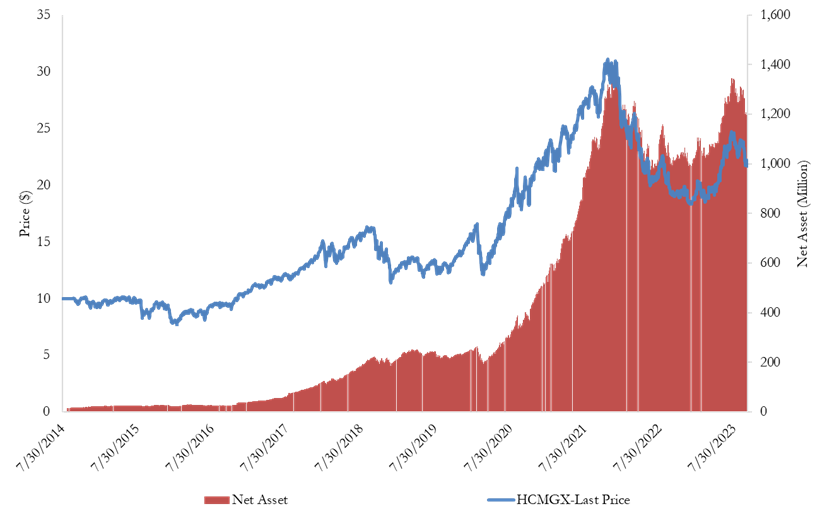
Figure 2 plots HCM Income Plus Fund's NAV and Net Assets from inception to the present.
Figure 2 HCM Income Plus Fund's NAV and Net Assets
Howard Capital Management has charged Income Plus Fund investors $31,845,999 including $19,938,175 in advisory fees since 2017.
$18,910,797 or sixty percent of those fees have been charged in the past two years. See Table 6.
Table 6 HCM Income Plus Fund Advisory Fees and Expenses Total $32 million.
Table 7 excerpts Income Plus Fund's expense table.[8]
Table 7 HCM Income Plus Fund Expense Table.
c. HCM Tactical Growth Fund
From the November 1, 2023 Prospectus[9]:
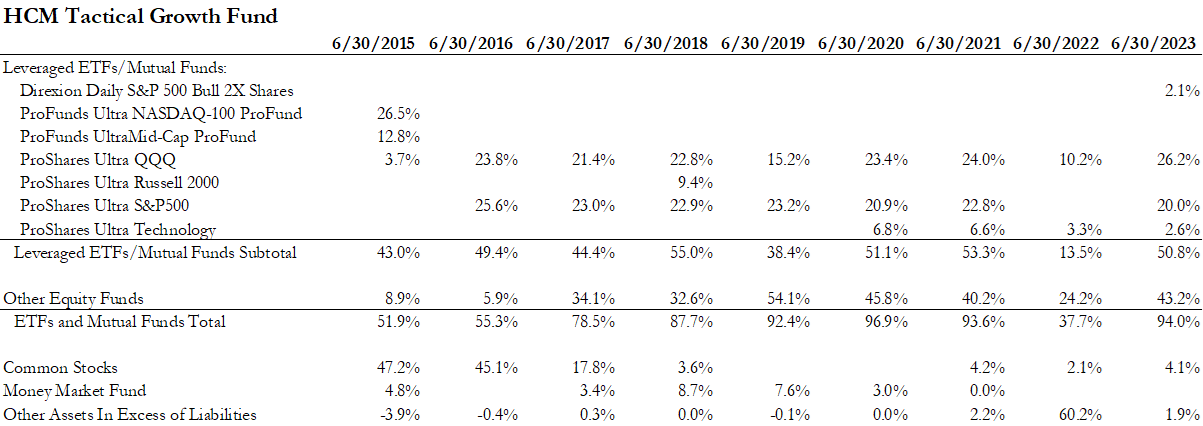
At year end June 30, 2022, HCM Tactical Growth Fund held 60% in cash. At each other year end from 2015 to 2023, the Fund was fully invested in equities,
mostly equity ETFs and of those mostly leveraged ETFs. See Table 8.
Table 9 HCM Tactical Growth Fund Expense Table.[10]
Howard Capital Management has charged Tactical Growth Fund investors $60,518,481 million including $41,711,770 in advisory fees since 2015.
$39,034,504 or two-thirds of those fees have been charged in the past two years. See Table 10.
Table 10 HCM Tactical Growth Fund Advisory Fees and Expenses Total $60 million.
d. Summary of Three Funds
The three funds discussed above hold $3.24 billion of the $3.98 billion in net assets in the seven HCM Funds.
These Funds primarily hold equity funds, roughly half their holdings are leveraged ETFs.
HCM has charged investors nearly $190 million in fees and expenses excluding expenses of the underlying fund holdings since inception, more than half of these charges in the most recent two years.
3. Examples of Violative Leveraged ETF Holdings.
The HCM Funds' public SEC filings reflect quarterly holdings. We understand that additional, non-public SEC filings contain monthly holdings.
Thus, the SEC will be able to more precisely identify holding periods. For now, we can offer two examples of long LETF holding periods in the HCM Funds.
a. Dividend Sector Plus Fund
The Dividend Sector Plus Fund held increasing quantities of both Ultra QQQ and Ultra S&P500 from May 29, 2020 through September 30, 2020 and beyond when its financials reflect no realized gains or losses
and therefore no possibility that in-and-out trading throughout the quarter led to similar quarter-end holdings. In fact, it appears these large LETF holdings continued to be continuously held
as late as May 2022. That is, these two LETFs, which account for roughly 50% of the Dividend Sector Plus Fund's holdings, were continuously held for between 5 months and 2 years.
If they were not held continuously for 2 years, they were held for at least two 5-month periods.
Table 11 HCM Dividend Sector Plus Fund LETF Holding Period Examples
b. Tactical Growth Fund
The Tactical Growth Fund held increasing quantities of both Ultra QQQ and Ultra S&P500 from June 30, 2020 through at least December 31, 2020 when its financials reflect no realized gains or losses
and therefore no possibility that in and out trading throughout the quarter led to similar quarter end holdings. As with the Dividend Sector Plus Fund,
it appears these large LETF holdings continued to be continuously held by the Tactical Growth Fund as late as May 2022. That is, these two LETFs which account for over 50% of the Tactical Growth Fund's
holdings were continuously held for between 5 months and 2 years. If they were not held continuously for 2 years then they were held for at least two 5-month periods.
Table 12 HCM Tactical Growth Fund LETF Holding Period Examples
4. Prospectus Disclosures
ProShares most recent Prospectus sections for Ultra QQQ, Ultra S&p 500 and Ultra Technology are attached. Proshares' Principal Risks disclosures are similar for the three funds which dominate the HCM Funds'
holdings. ProShares QQQ disclosure for example reads:
None of this Proshares' Holding Period Risk disclosure - which is the most extensive and only highlighted disclosure in the ProShares' Prospectus is made in the HCM Funds' Prospectuses despite
leveraged ETFs making up 50% or more of the HCM Funds' portfolios and being held for long periods.
None of the four most recent HCM Prospectuses mentions investing in leveraged and inverse ETFs, holding period risk or daily rebalancing.[12]
The four Prospectuses contain substantially the same language in the same format so my comments will use the most recent filing to illustrate the nondisclosure of material risks.
In the Prospectus at p.3 for the Dividend Sector Plus Fund, at p. 9 for the Tactical Growth Fund and at p.16 for the Income Plus Fund there is the following risk factor.
Leverage Risk: The Underlying Funds in which the Fund may invest may use leverage including through use of a line of credit through a bank.
Using leverage can magnify a mutual fund's potential for gain or loss and therefore, amplify the effects of market volatility on a mutual fund's share price.
This disclosure doesn't mention leveraged and inverse ETFs, holding period risk or daily rebalancing and is #6 of 13 for the Dividend Sector Plus, #5 of 12 for the Tactical Growth Fund and #10 of 17 for
the Income Plus Fund. HCM's disclosure is boilerplate language found in the prospectus for any fund that uses any leverage and doesn't convey the well know risks which are unique to leveraged
and inverse ETFs which dominate HCM Funds' holdings.
The 2023 Prospectus contains a more lengthy entry on Underlying Fund Risk.[13] As with the summary risks in the Prospectus, this more detailed description of risks related to underlying ETFs
makes no mention of the principal risks (lengthy holding periods and daily rebalancing) which the leveraged and inverse ETF issuers treat most fully.
Underlying Fund Risk: The Fund invests in investment companies ("Underlying Funds"). As a result, your cost of investing in the Fund will be higher than the cost of investing
directly in investment companies and may be higher than other investment companies that invest directly in stocks and bonds. You will indirectly bear fees and expenses charged by the Underlying Funds
in addition to the Fund's direct fees and expenses. When the Fund invests in Underlying Funds that use margin, leverage, short sales and other forms of financial derivatives, such as options and futures,
an investment in the Fund may be more volatile than investments in other mutual funds. Short sales are speculative investments and will cause the Fund to lose money if the value of a security
sold short by the Underlying Fund in which the Fund invests, does not go down as the Underlying Fund manager expects. Additional risks of investing in investment companies are described below:
ETF Tracking Risk: Investment in the Fund should be made with the understanding that the passive ETFs in which the Fund invests will not be able to replicate exactly the performance
of the indices they track because the total return generated by the securities will be reduced by transaction costs incurred in adjusting the actual balance of the securities.
In addition, the passive ETFs in which the Fund invests will incur expenses not incurred by their applicable indices. Certain securities comprising the indices tracked by the passive ETFs may,
from time to time, temporarily be unavailable, which may further impede the passive ETFs' abilities to track their applicable indices.
Expense Risk: The Fund invests in Underlying Funds. As a result, your cost of investing in the Fund will be higher than the cost of investing directly in an investment company and may be
higher than other mutual funds that invest directly in stocks and bonds. You will indirectly bear fees and expenses charged by the Underlying Funds in addition to the Fund's direct fees and expenses.
Leveraging Risk: The use of leverage by the Underlying Funds, such as borrowing money to purchase securities, engaging in reverse repurchase agreements, lending portfolio securities and
engaging in forward commitment transactions, will magnify the Underlying Fund's gains or losses. During periods in which an Underlying Fund is utilizing financial leverage,
the fees that are payable to the Adviser as a percentage of the Underlying Fund's assets may be higher than if the Underlying Fund did not use leverage, because the fees are calculated as a percentage
of the Underlying Fund's assets, including those purchased with leverage.
Management Risk: When the Fund invests in Underlying Funds there is a risk that the investment advisers of those Underlying Funds may make investment decisions that are
detrimental to the performance of the Fund.
Mutual Fund Risk (HCM Tactical Growth Fund & HCM Dividend Sector Plus Fund only): The strategy of investing in Underlying Funds that are mutual funds could affect the timing,
amount and character of distributions to you and therefore may increase the amount of taxes you pay. In addition, certain prohibitions on the acquisition of mutual fund shares by the Fund may
prevent the Fund from allocating its investments in the manner the Adviser considers optimal. The Fund intends to purchase mutual funds that are either no-load or waive the sales load for
purchases made by the Fund. The Fund will not purchase mutual funds that charge a sales load upon redemption. In the event that a mutual fund charges a redemption fee, then you will indirectly
bear the expense by investing in the Fund. Mutual funds whose shares are purchased by the Fund will be obligated to redeem shares held by the Fund only in an amount up to 1% of the mutual fund's
outstanding shares during any period of less than 30 days. Shares held by the Fund in excess of 1% of a mutual fund's outstanding shares therefore, may be considered not readily marketable securities,
which together with other such securities, may not exceed 15% of the Fund's total assets. When the Fund focuses its investments in certain mutual funds, the Fund's portfolio will have a risk profile
for such investments that will correspond to that of such mutual funds and Management Risk, described above, increases proportionately.
Net Asset Value and Market Price Risk: The market value of the closed-end shares may differ from their net asset value. This difference in price may be due to the fact that the supply
and demand in the market for fund shares at any point in time is not always identical to the supply and demand in the market for the underlying basket of securities. Accordingly, there may be times
when shares trades at a premium or discount to net asset value.
Strategies Risk: Each Underlying Fund is subject to specific risks, depending on the nature of the fund. These risks could include liquidity risk, sector risk, and foreign currency risk,
as well as risks associated with fixed income securities and commodities.
5. Conclusion
Howard Capital Management (HCM) manages nearly $4 billion in net assets in 4 mutual funds and 3 ETFs. In addition, HCM manages individual accounts.
HCM claims to use technical analysis to allocate portfolio assets to stocks and cash.
HCM uses leveraged ETFs for a significant portion of its equity exposure.
HCM inappropriately holds leveraged ETFs for at least 6 months and perhaps longer than a year. This conduct goes back to 2015 but appears to have gotten much worse since 2020.
HCM does not disclose the Holding Period Risk or daily rebalancing risk which is an emphasized principal risk disclosed by the issuers of the leveraged ETFs which dominate HCM's fund portfolios.
[2] See "Crooked Volatility Smiles: Evidence from Leveraged and Inverse ETF Options" with Geng Deng, Tim Dulaney and Mike Yan, Journal of Derivatives and Hedge Funds, (2013) 19, 278-294,
"The Properties of Short Term Investing in Leveraged ETFs" with Geng Deng, Journal of Financial Transformation, October 2012 and "Leveraged ETFs, Holding Periods and Investment Shortfalls"
with Ilan Guedj and Guohua Li, 2010, Journal of Index Investing Winter 2010 vol. 1, no. 3.