You can download a pdf of this article to print or email here.
Introduction
GWG bonds were always impaired. GWG was able to sell impaired bonds for 10 years because its equity float was too small to be covered by Wall Street analysts, its stock was too thinly traded to short sell and third tier brokerage firms looked the other way in exchange for extraordinary sales commissions.
In "GWG's Decade-long Fraud Started Well Before Beneficient Joined In" we explain how GWG wrote down the claimed fair market value of its insurance portfolio in 2019 by bringing its exaggerated mortality risk assumptions - used in estimating how long it would have to pay insurance premiums and how long it would have to wait until it received death benefits - closer in line with standard mortality tables.
Rather than be honest about the $179,221,656 write-off resulting from its partial correction of mortality assumptions, GWG slipped in a $87,231,656 overstatement by dramatically reducing the discount rate without disclosing the impact of this reduction.In a future post, we will explain the discount rate issue more fully but for now we explain how we corrected GWG's inflationary and counterfactual mortality risk assumptions and demonstrate that L Bonds were impaired from the beginning.
GWG's SEC Filings Contain a Poppy Field of Red FlagsWithout belaboring the point in this brief post, virtually every GWG SEC filing includes language that GWG is consistently receiving fewer death benefits and paying more premiums than it expected based on the non-standard mortality estimates it was using. It would have been apparent to any analyst critically evaluating an investment in GWG I Bonds, L Bonds and preferred stock that GWG was inflating revenues and assets.
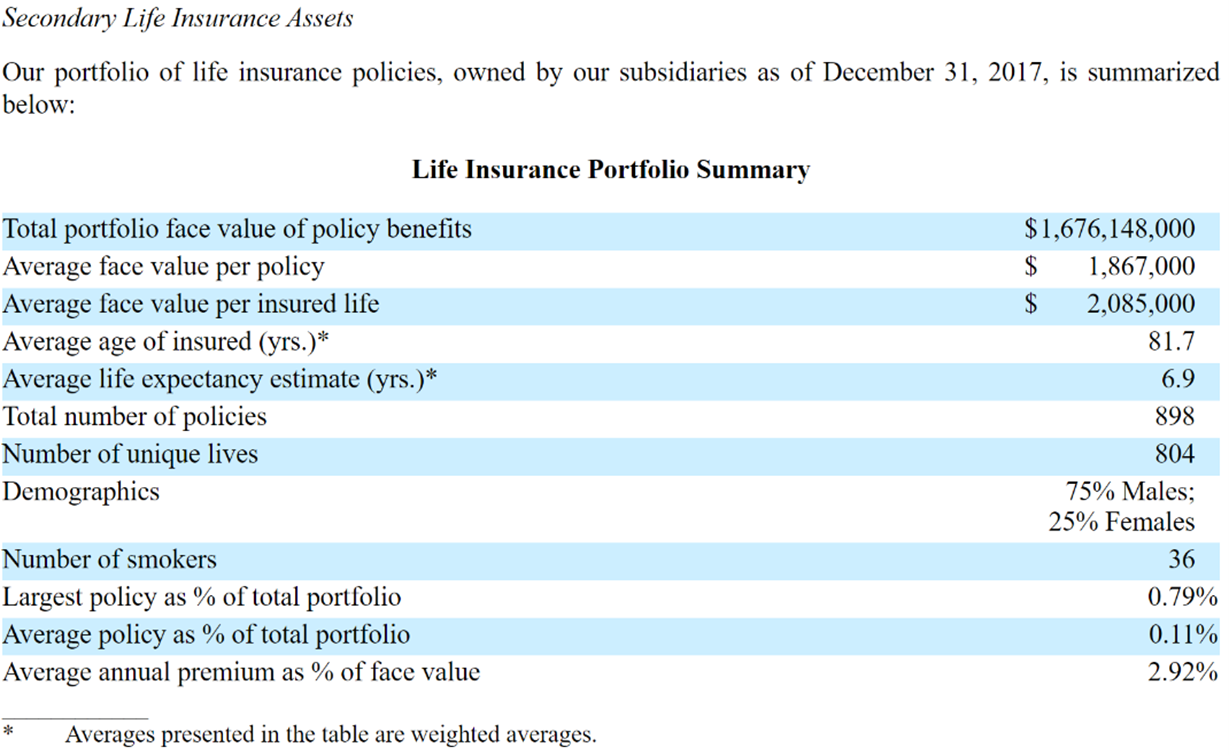
Every GWG 10-Q and 10-K contains a table of summary information on its current insurance contract portfolio. Table 1 is one such example taken from the 2017 10-K at page 5. [1]
Table 1 GWG Life Insurance Portfolio Summary, December 31, 2017
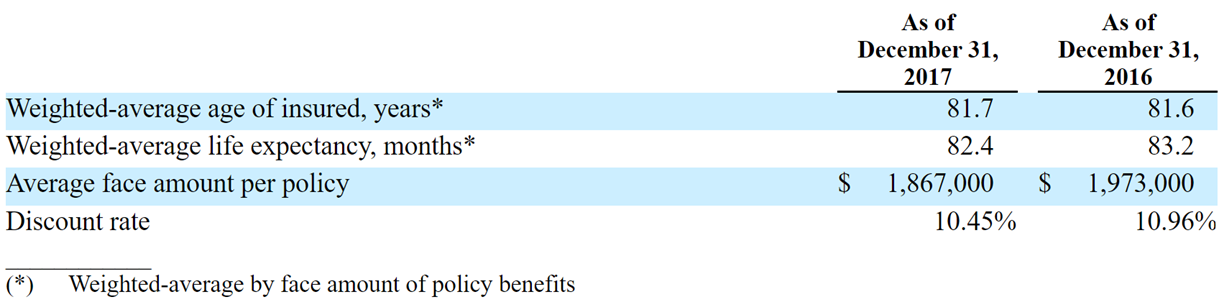
GWG's filings also include a table summarizing the valuation inputs used in its discounted cashflow model to value the insurance contracts. This example comes from the same 2017 10-K at page F-13.
Table 2 Summary of Valuation Inputs, December 31, 2017
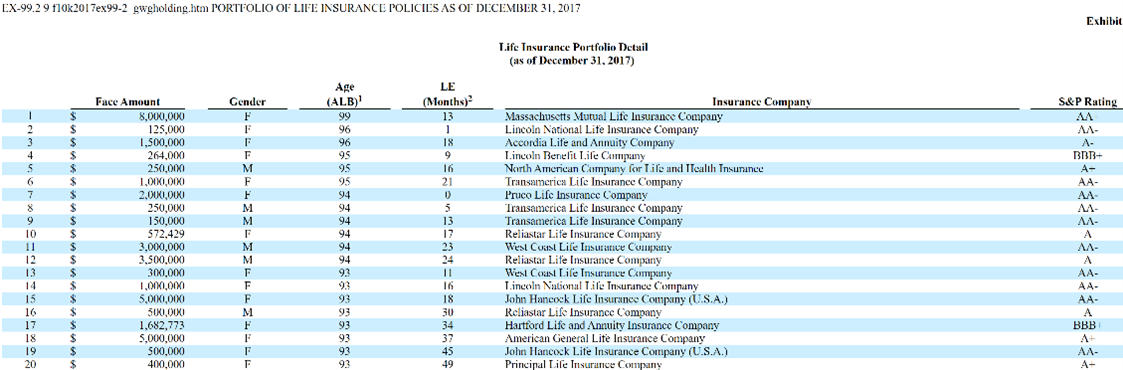
In earlier years, GWG itemized the insurance contracts in the body of its SEC filings but later this detailed information could be found in an exhibit attached to the filing. The example in Table 3 is the first 20 rows of portfolio detail as of December 31, 2017 found in Ex 99.2 to the 2017 10-K. [2]
Table 3 Insurance Portfolio Detail, December 31, 2017
The portfolio details in Table 3 include the face value, gender, age at last birthdate and remaining life expectancy of each contract holder. The summary information in Table 1 and Table 2 can be derived from the details in Table 3.
Mortality Risk and Standard Tables
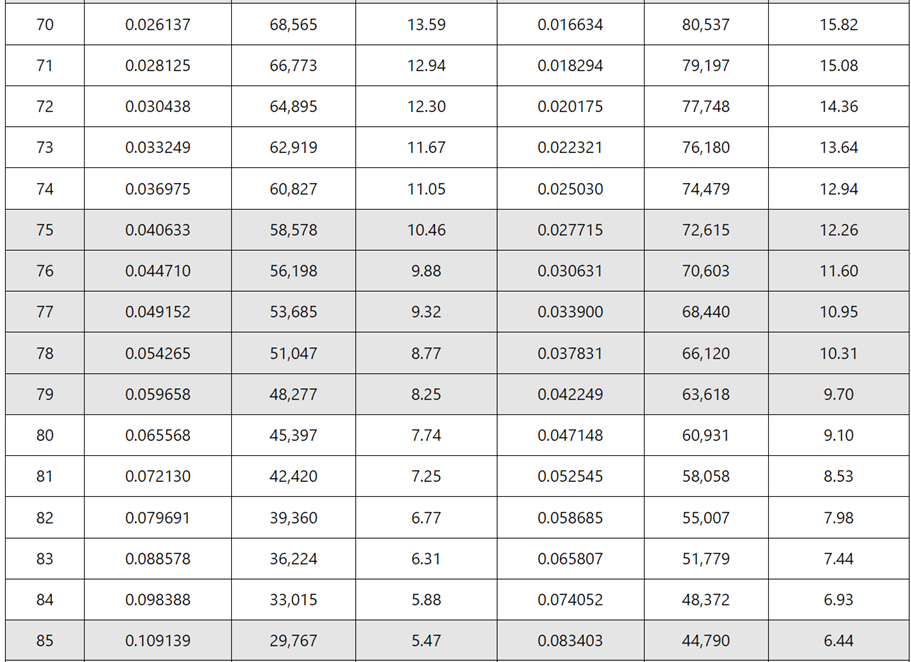
The Social Security Administration produces standard actuarial tables each year. The rows for ages 70 to 85 from the 2017 Life Table are reproduced in Table 4. This information allows us to estimate the average probability of males and females of different ages dying in each future year. [3]
Table 4 SSA's 2017 Life Expectancy by Gender and Age
The SSA mortality information in Table 4 can be applied to each contract holder itemized in GWG's portfolio detail illustrated in Table 3. This effort requires a minimum familiarity with mortality tables which is a low bar for selling GWG L Bonds since FINRA requires brokerage firms to be familiar with the business backing new securities and GWG's business model was entirely dependent on mortality risk.
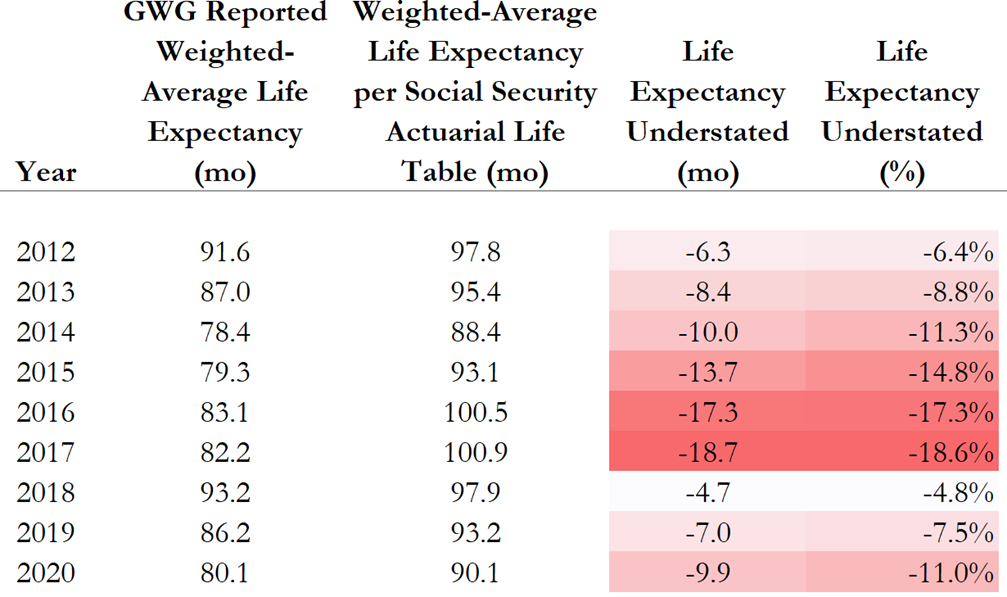
Table 5 lists the weighted average remaining life GWG reported and used to value its insurance portfolio. We also include the weighted average remaining life expectancy based on each year's SSA Life Table.
Table 5 GWG Increasingly Understated Remaining Life Expectancy
Notice that GWG increasingly understated its portfolio's remaining life expectancy compared to standard mortality tables until 2018 when it partially corrected its understatements. This ever increasing understatement of remaining life expectancies allowed GWG to claim lower future premium payments and earlier expected death benefit payouts thereby increasingly overstating the value of its insurance portfolio.
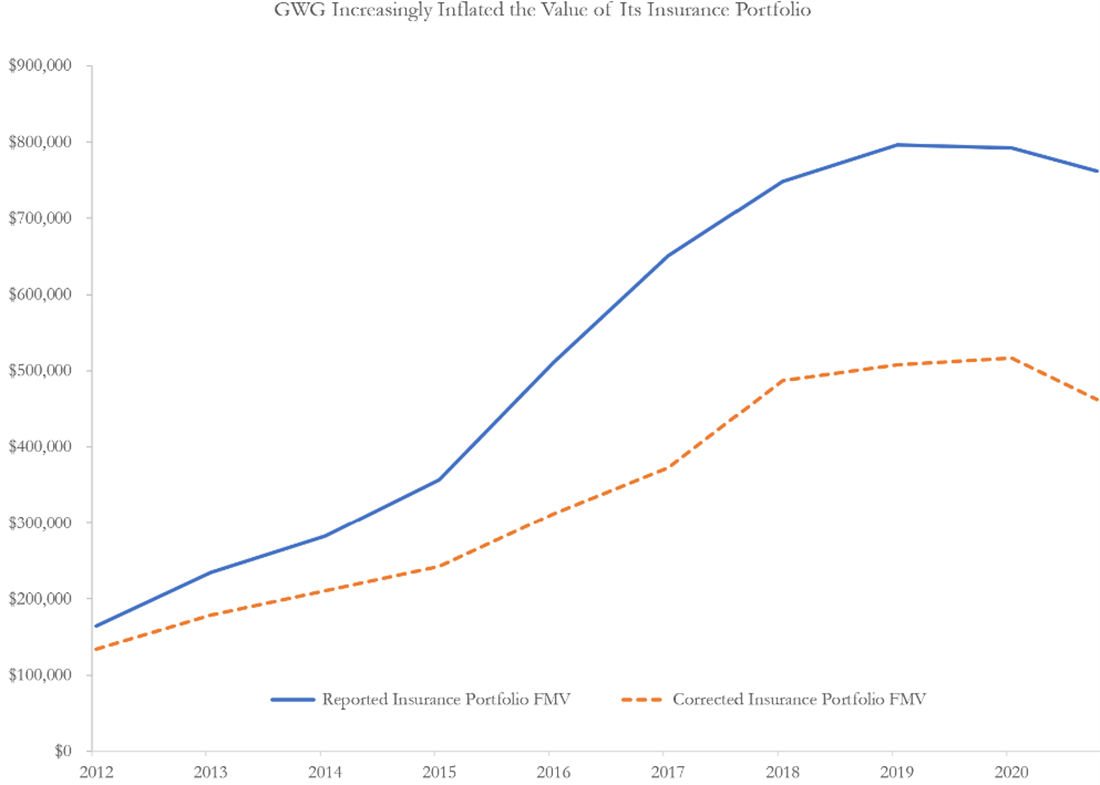
Figure 1 plots GWG's reported portfolio fair market values using its vendors' life expectancy reports and the fair market values it would have derived using the SSA Life Tables.
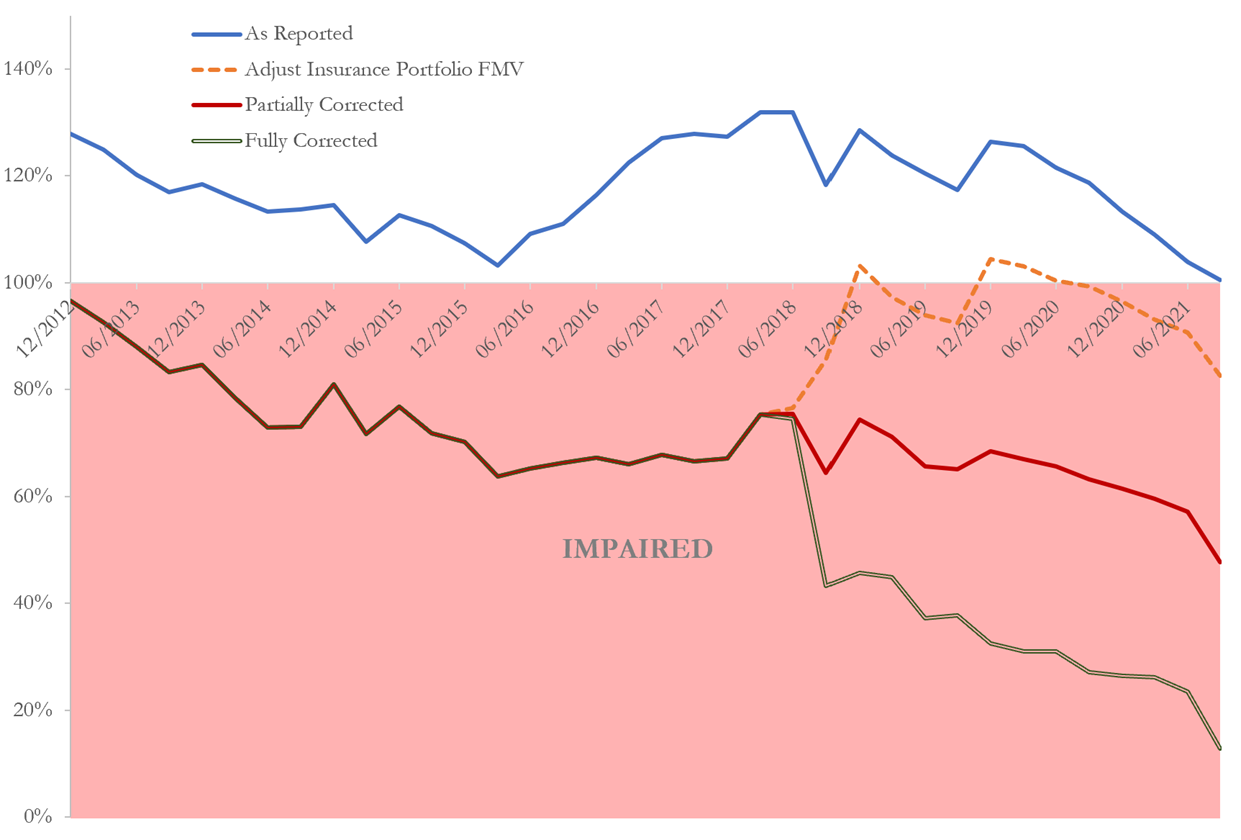
Figure 2 plots the asset coverage available to I Bonds and L Bonds defined as (assets minus secured debt) divided by (I Bond and L Bond face values).
The blue line in Figure 2 assumes GWG's portfolio of insurance contracts was worth the reported fair market value and its equity interest in Beneficient was worth what GWG claimed based entirely on Beneficient's farcical $1.5 billion in intangible assets.
The orange dashed line in Figure 2 plots the asset coverage ratio after correcting the value of the insurance portfolio but assuming GWG's equity interest in Beneficient was worth 100% of its claimed value.
The red line assumes GWG's equity interest in Beneficient was worth 40% of the reported value. At 40%, L Bond holders are not made better or worse off by the Beneficient merger when it appears clear the L Bond holders were immediately harmed by the merger.
The double grey line in Figure 2 corrects the reported fair market value of the insurance portfolio and places a $0 value on GWG's equity interest in Beneficient. We believe this double grey line captures the most plausible coverage ratio, reflecting a further deterioration in the security available to L Bond holders as a result of the merger with Beneficient.
Figure 2 GWG Bond Coverage Ratio Always Less than 100% and Declining
Disclosure of Beneficient's highly dubious intangible assets has been incorrectly attributed to a self-serving August 2019 due diligence report. See for example, Proposed Complaint at ¶170 attached to Motion of the Official Committee of Bondholders of GWG Holdings Inc., et al., For Standing to Prosecute Causes of Action on Behalf of the Debtors' Estates, Case No. 22-90032, Document 1250.
GWG's Schedule 14C filing on December 6, 2018 revealed Beneficient's intangible assets and goodwill. [4] Certain parts of Beneficient's claimed intangible assets were reclassified as goodwill when GWG filed 10-K for 2018 on July 9, 2019 but that Beneficient's assets were wildly overstated by worthless intangible assets was disclosed in GWG's SEC filing on December 8, 2018 and part of the public record any brokerage firm considering selling L Bonds should have incorporated into its due diligence. [5]
Conclusion
We have focused in this note on the inflationary impact of GWG's mortality assumptions on its reported asset values. The inflated asset values at each point in time equal the cumulative inflated revenues up through that point in time since GWG was recognizing changes in the reported fair market values as revenue.
GWG bonds were always impaired. An analyst critically evaluating GWG with basic understanding of mortality tables would uncover what we explain above in a day or two. GWG was able to continue to sell impaired bonds for 10 years because its equity float was too small to be covered by Wall Street analysts, its stock was too thinly traded to short sell and third tier brokerage firms were happy to look the other way in exchange for extraordinary sales commissions.