We previously published Reg D Offerings Summary Statistics describing the aggregate issuance totaling over $20 trillion between 2009 and July 2022. You can read that post here.
In this post we provide summary statistics for Reg D offerings sold by broker dealers. You can get a pdf copy of this post to print or email by clicking here. Next week, we will be posting information on the extremely high failure rates for Reg D offerings.
I. Introduction
The Regulation D ("Reg D") offerings sold by U.S. broker-dealers account for 14% of all Reg D offerings and 39% of the total dollar amount offered. This installment of our blog post series on the Reg D market reports summary statistics for Reg D offerings sold by at least one U.S. broker-dealer.
II. Overall Summary Statistics
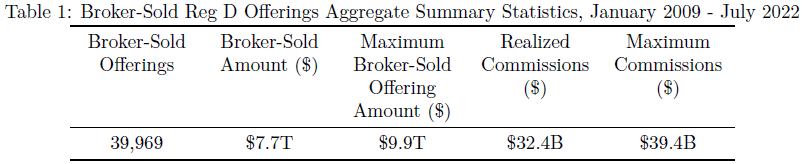
Table 1 reports aggregate summary statistics of the Reg D offerings sold by broker-dealers between January 2009 and July 2022. There were 39,969 unique broker-sold offerings. $7.7 trillion had been sold by broker-dealers as of the most recent Form D filing in each offering and the aggregate maximum broker-sold offering amount across all broker-sold offerings was $9.9 trillion. Thus, between $7.7 trillion and $9.9 trillion in exempt securities were sold by broker-dealers between January 2009 and July 2022. The maximum sales commissions for selling the entirety of the maximum broker-sold offering amount are $39.4 billion, of which $32.4 billion has been paid out to broker-dealers as of the most recent Form D filings.
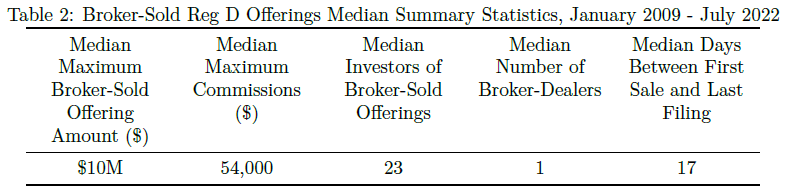
Table 2 reports median summary statistics of the broker-sold Reg D offerings. The median maximum offering size was $10 million, the median number of investors as of the last Form D filing in each offering was 23 and the median days between first sale and last filing was 17 days. Compared to the Reg D offerings not sold by any broker-dealer, the broker-sold Reg D offerings tend to be larger and sold to more investors.[4] The median maximum commissions paid out to broker-dealers for selling a Reg D offering was $54,000, and more than half of the broker-sold Reg D offerings were sold by a single broker-dealer.
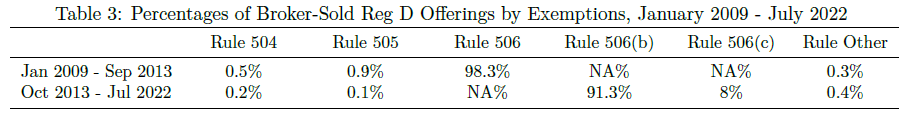
Table 3 reports the frequency of exemption choices in broker-sold Reg D offerings from January 2009 to September 2013 and from October 2013 to July 2022.[5] After September 2013, 91.3% of broker-sold Reg D offerings elected exemption under Rule 506(b) which allows for sales to nonaccredited investors and only 8% elected exemption under 506(c) which limits sales to only accredited investors.
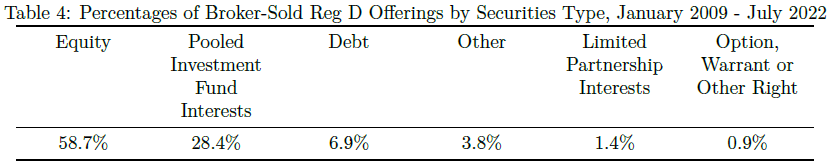
Table 4 reports the distribution of security types identified in the Form D filings of broker-sold offerings. 58.7% of the offerings are identified as equity securities, 28.4% are identified as pooled investment fund interests and 6.9% are identified as debt securities.[6]
III. Industry Distribution
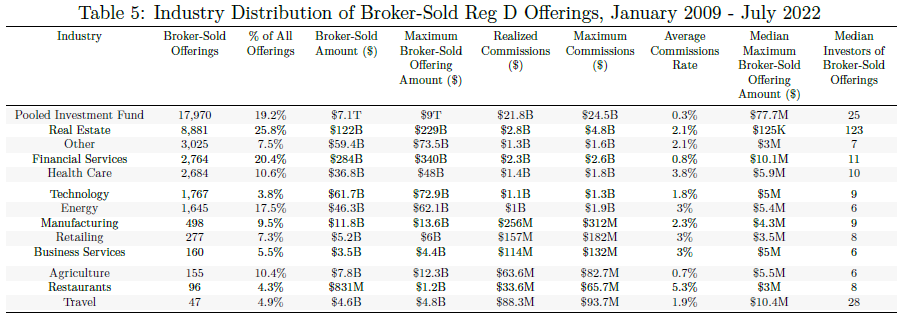
Table 5 and Figures 1(a)-(b) describe the industry distribution of broker-sold Reg D offerings sold between January 2009 and July 2022. Pooled Investment Fund ("PIF") is the largest industry group by any measure of broker-sold Reg D offerings, leading the other industries by a large margin. PIF issuers account for 45% of the broker-sold Reg D offerings and 91.2% of the aggregate maximum broker-sold offering amount. The Real Estate industry ranks second in terms of the total number of broker-sold offerings and aggregate maximum commissions for broker-dealers. Financial Services ranks second in terms of aggregate maximum broker-sold offering amount. Among the seven industries with more than 1,000 broker-sold offerings, the Health Care industry has the highest average commissions rate (3.8%) while PIF issuers pay the lowest commissions (0.3%).[7] Broker-sold Reg D offerings account for 25.8% of all Reg D offerings in the Real Estate industry, a percentage higher than any other industry.
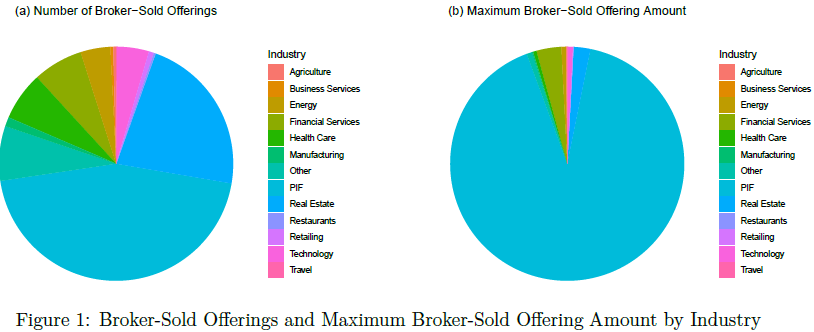
The issuers in the PIF industry tend to raise more money per broker-sold offering. The securities in the Real Estate industry tend to be sold to more investors per broker-sold offering. See Figures 2(a)-(b).
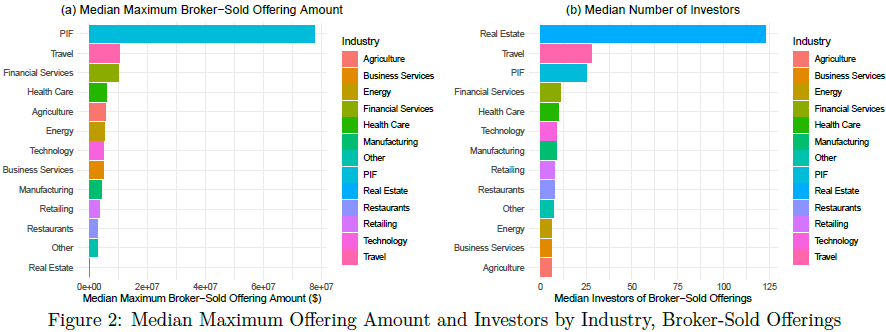
Figures 3(a)-(b) illustrate the distributions of the exemption claimed and the type of securities involved in broker-sold Reg D offerings, respectively, across the top five industries ranked by the total number of broker-sold offerings. Most broker-sold Reg D offerings claim Rule 506(b) as the reason for exemption. 15% of the broker-sold offerings in the Financial Services industry claim exemption under Rule 506(c), highest across the five industries. The majority of broker-sold Reg D securities are Equity - Equity securities account for more than three quarters of the broker-sold Reg D offerings in Real Estate, Health Care and Technology, while about 40% of the broker-sold offerings in PIF and Financial Services industries are based on Equity. Financial Services is the industry where Debt securities are the most frequently used, with 29% of the broker-sold offerings in Financial Services using Debt securities. 14% of the broker-sold offerings in Financial Services involve securities from the "Other" category, higher than any other industry.
IV. Time Trends
Presented below are various statistics measuring the intensity of broker-sold Reg D offerings in each year between 2009 and 2021 in the entire market as well as in each of the top five industries ranked by the total number of broker-sold offerings.
All Industries
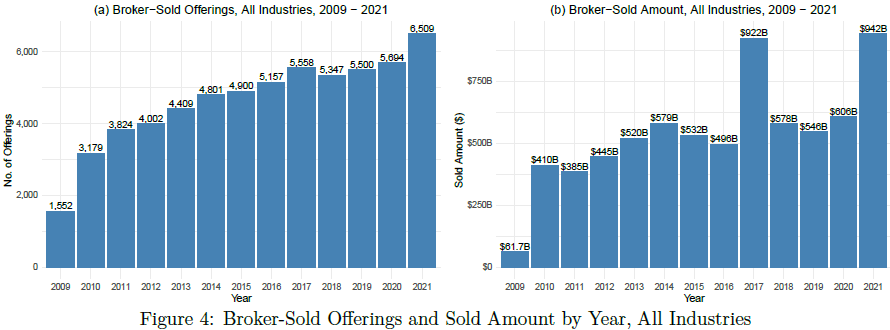
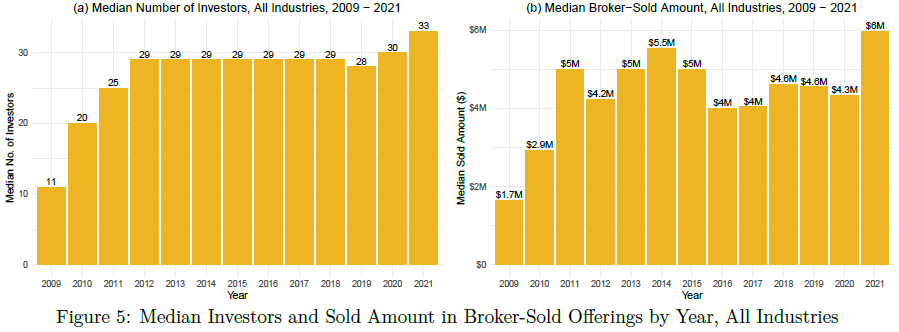
Figure 4(a) shows that the number of broker-sold Reg D offerings has been steadily increasing since 2009. Figure 4(b) illustrates that the aggregate amount sold by broker-dealers has also been moderately trending upwards since 2011 although there were more fluctuations around the trend. Figure 5(a) shows that the median number of investors in broker-sold offerings stayed at 29 between 2012 and 2018 before rising above 30 in 2020 and 2021. Figure 5(b) shows that the median amount sold by broker-dealers almost tripled from 2009 to 2015 before plateauing between 2016 and 2020. There was a large year-over-year increase in the aggregate amount and the median amount sold by broker-dealers from 2020 to 2021. See Figures 4(b) and 5(b).
Pooled Investment Fund
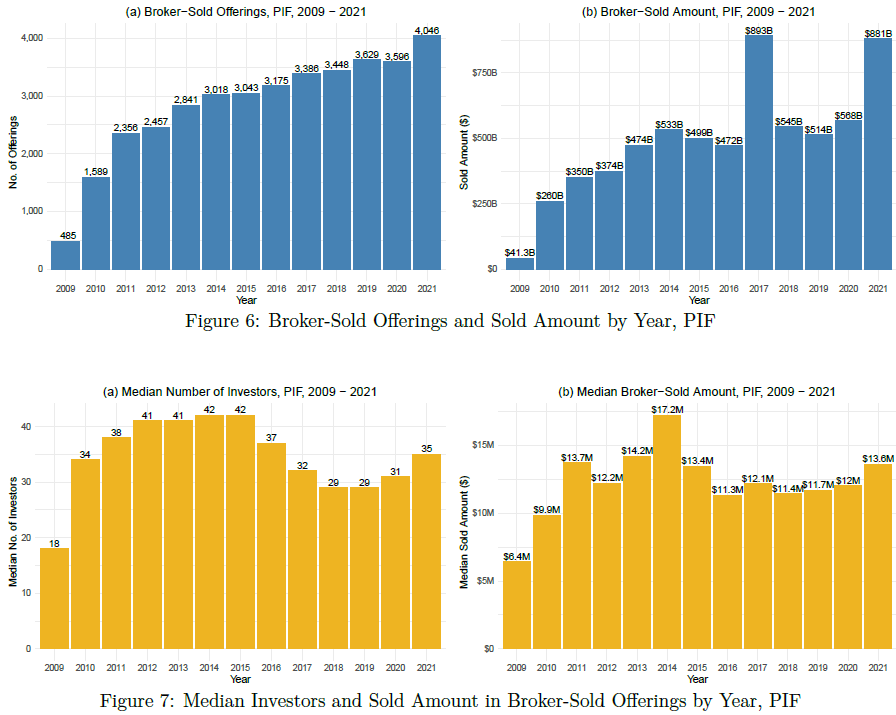
Figures 6(a)-(b) show that the number of PIF offerings sold by broker-dealers has been continuously rising since 2009, and the aggregate amount sold by broker-dealers in PIF offerings also has an upward trend. PIF offerings sold by broker-dealers between 2016 and 2021 tend to be sold to fewer investors than those sold between 2011 and 2015, although the median number of investors buying PIF offerings from broker-dealers was increasing in the past three years. See Figure 7(a).
Real Estate
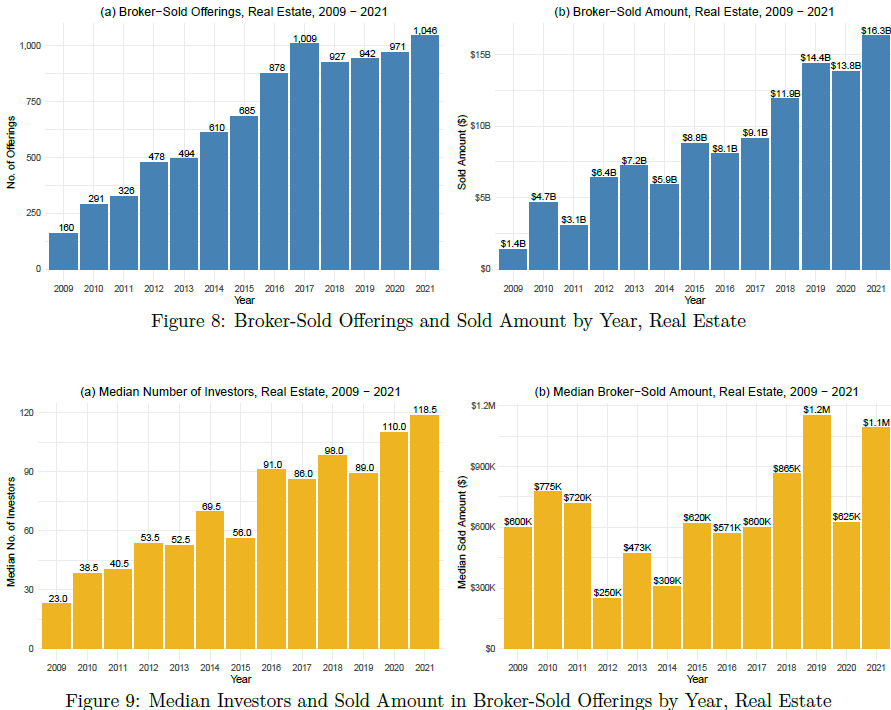
Figures 8(a)-(b) show that the market for broker-sold offerings in the Real Estate industry has grown rapidly since 2009 as measured by either the number of offerings or the aggregate amount sold by broker-dealers. Figure 9(a) illustrates that broker-sold Real Estate offerings tend to attract more investors in recent years. The median amount sold by broker-dealers in Real Estate offerings is also higher in the period of 2019-2021 compared to the period of 2012-2014. See Figure 9(b).
Financial Services
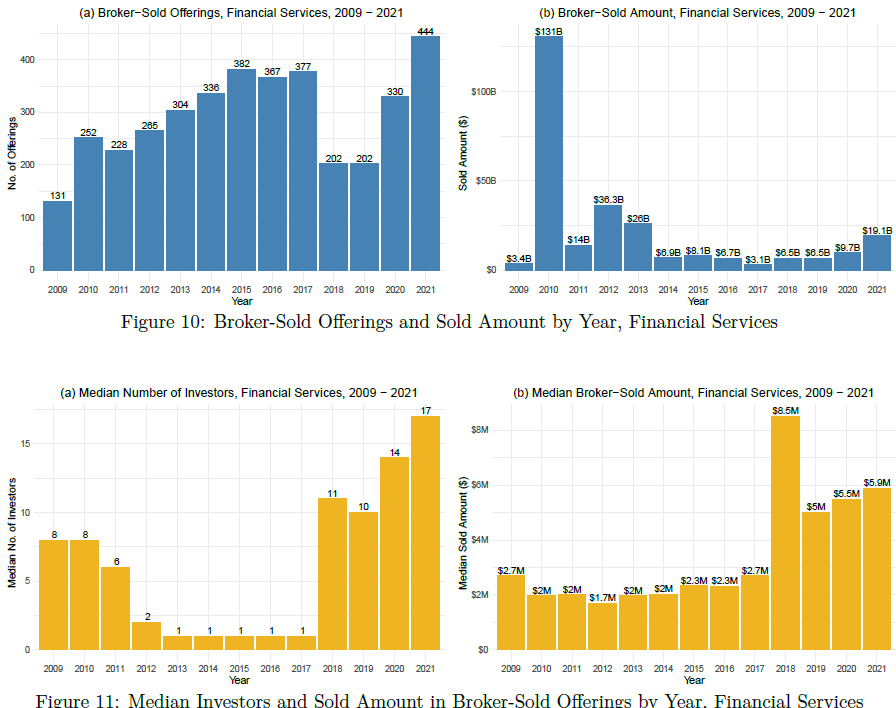
Figures 10(a) shows that the number of broker-sold offerings in the Financial Services industry was steadily increasing between 2009 and 2017, fell almost by half in 2018 and rose sharply in 2020 and 2021. While more than half of the broker-sold offerings in the Financial Services industry were sold to a single investor in each year of 2013-2017, the median number of investors in broker-sold Financial Services offerings jumped to 11 in 2018 and continued to rise afterwards. See Figure 11(a). Figure 11(b) illustrates that the median broker-sold amount in Financial Services offerings has been trending upwards since 2012.
Health Care
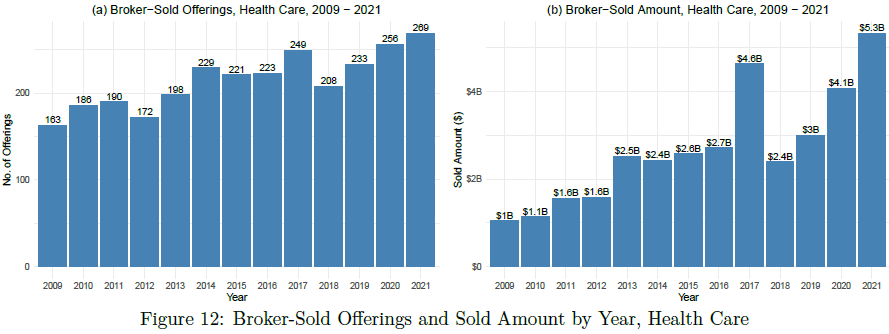
Figures 12(a)-(b) show that both the number of broker-sold offerings and the aggregate amount sold by broker-dealers in the Health Care industry have been trending upwards since 2009. The median broker-sold amount in Health Care offerings increased by almost 200% from 2018 to 2021. See Figure 13(b).
Technology
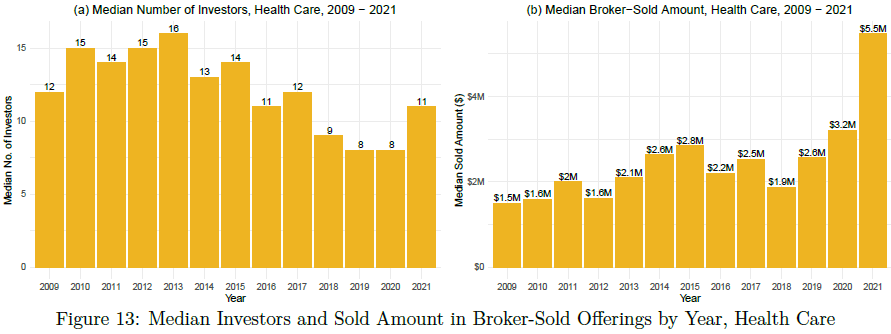
The number of Technology Reg D offerings sold by broker-dealers was rising from 2009 to 2015, fell back to the 2009-level in 2019 and increased sharply again in 2020 and 2021. See Figure 14(a). Figure 15(b) shows that the median amount sold by broker-dealers in Technology offerings was increasing quickly between 2016 and 2021, with the year-over-year increase from 2020 to 2021 exceeding 150%.
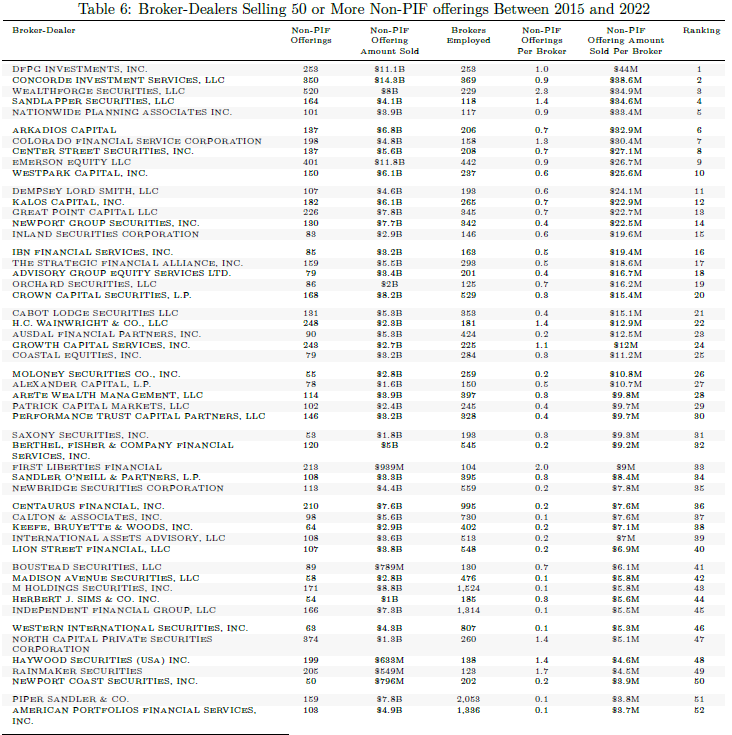
V. Broker-Dealers Selling the Most Non-PIF Offerings
In this section we publish a list of medium- and large-sized broker-dealers that sold Reg D offerings with an issuer not from the Pooled Investment Fund (PIF) industry.[8] 427 medium- and large-sized broker-dealers sold at least one non-PIF offering in 2015 or later. 87 (or 20.4%) of these broker-dealers sold at least 50 non-PIF offerings. Table 6 reports the 87 broker-dealers selling at least 50 non-PIF offerings between 2015 and 2022, ranked by the total non-PIF offering amount sold divided by the number of brokers employed.[9]
[1] CraigMcCann@slcg.com, 202-251-0273.
[2] MikeYan@slcg.com, 703.539.6767.
[3] ChuanQin@slcg.com, 703.539.6764.
[4] See Table 2 in "Regulation D Offerings Summary Statistics", SLCG Economic Consulting, LLC, 2022.
[5] The SEC adopted amendments to Reg D to replace Rule 506 with Rule 506(b) and Rule 506(c) in September 2013.
[6] Form D allows issuers to select "Pooled Investment Fund" as their industry group (Item 4) and "Pooled Investment Fund Interests" as the type of securities offered (Item 9).
[7] The average commissions rate is calculated as the aggregate maximum commissions divided by the aggregate maximum broker-sold offering amount.
[8] Reg D offerings issued by Pooled Investment Funds, including hedge funds and private equity funds, are often sold to institutional investors rather than retail investors. Excluding these offerings from the data enables us to identify broker-dealers that potentially cause the most harm to retail investors. A broker-dealer is medium- or large-sized if it had 100 or more registered brokers between January 2015 and July 2022.
[9] The total non-PIF offering amount sold by a broker-dealer is calculated by adding the amounts sold in 2015 or later reported in all non-PIF offerings that list the broker-dealer as recipient of sales commissions. This is likely an overestimation of the actual amount sold by the broker-dealer because many broker-sold offerings report multiple broker-dealers as receiving sales commissions and only the total amount sold by all the broker-dealers combined.