Securities issuers can either register their securities with the Securities and Exchange Commission, making extensive information about their business and the offering publicly available, or they can sell unregistered securities making almost no information available to regulators. Issuers of unregistered securities file Form D reports with the SEC on which the issuers provide cursory information and claim an exemption from registration requirements under either Rule 506(b) or Rule 506(c). Rule 506(b) allows for sales to up to 35 nonaccredited investors but prohibits general advertising. Rule 506(c) allows general advertising but requires all purchasers to be accredited investors.[1] Almost all exempt offerings are sold pursuant to Rule 506(b) and so can be sold to nonaccredited investors.
In recent years, more securities have been issued and sold to investors subject to these exemptions from registration than have been issued with the benefits of SEC Registration. In 2019, over $1.5 trillion in unregistered securities were issued compared to only $1.2 trillion in registered securities.[2]
There is very little research on the returns to exempt securities offerings. Issuers are not required to file updated Form D reports as an offering progresses including when an offering is complete. The Form D reports typically list the maximum offering amount and amount sold as of the filing date. Issuers do not make the offering circulars public and do not publish financial results.
The dramatic increase in exempt offerings sold to nonaccredited investors and the lack of information on issuers raises very serious investor protection concerns. 14% of Regulation D ("Reg D") offerings and 39% of the maximum offering amount were sold through broker-dealers. Customer complaints against broker-dealers involving illiquid investments (non-traded REITs and BDCs, private equity, and limited partnerships) have increased from 10% to 43% of customer complaints between 2018 and 2021.[3] This increase in customer complaints may significantly understate the potential problem. Without reliable market values, investors who bought these broker-sold Reg D offerings may not know they have suffered losses or suspect their broker of misconduct; investors who buy exempt securities directly from issuers have even less information and less recourse.
In installments, we are going to publish our analysis of the market for Reg D securities. This first installment reports summary statistics based on our review of all Form D reports filed with the SEC from January 1, 2009 through July 31, 2022. We present the number, dollar amount raised and other characteristics of the securities offered under Reg D in aggregate and broken out by issuer's industry and year of sale.
Future installments will (1) report summary statistics for broker-sold Reg D securities, (2) document the connection between Reg D sales and customer complaints, and (3) illustrate specific examples of potentially problematic offerings.
II. Overall Summary Statistics
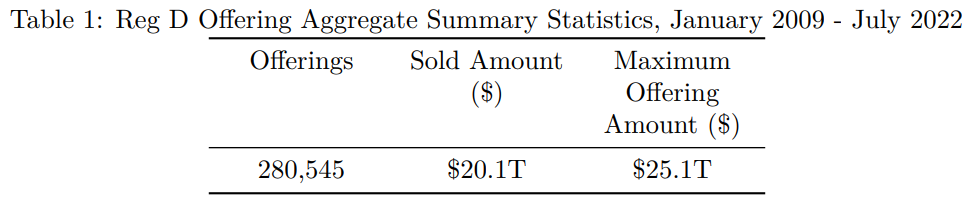
Table 1 reports aggregate summary statistics of the Reg D offerings sold between January 2009 and July 2022. There were 280,545 unique offerings. $20.1 trillion had been sold as of the most recent Form D filing in each offering and the aggregate maximum offering amount across these sold offerings was $25.1 trillion.[4] Thus, between $20.1 trillion and $25.1 trillion in exempt securities were sold between January 2009 and July 2022.
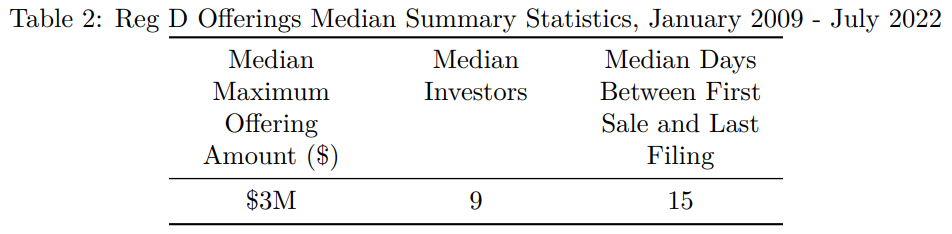
The median maximum offering size was $3 million, the median number of investors as of the last Form D filing in each offering was 9 and the median days between first sale and last filing was 15 days. That is, Reg D offerings are small and the latest Form D is filed shortly after the first investor purchases a security when the number of investors remains quite low. See Table 2.
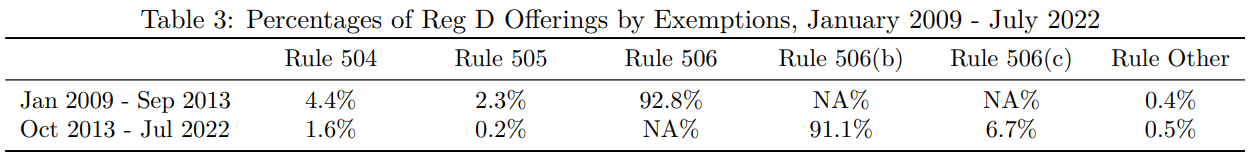
Table 3 reports the frequency of exemption choices from January 2009 to September 2013 and from October 2013 to July 2022. The SEC adopted amendments to Reg D to replace Rule 506 with Rule 506(b) and Rule 506(c) in September 2013. After September 2013, 91.1% of Reg D offerings elected exemption under Rule 506(b) which allows for sales to nonaccredited investors and only 6.7% elected exemption under 506(c) which limits sales to only accredited investors.
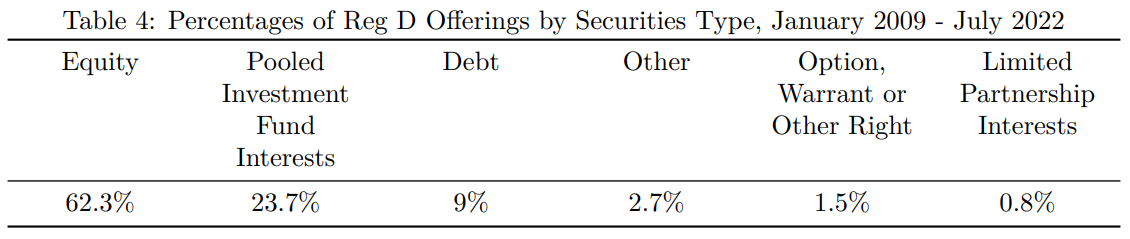
Table 4 reports the distribution of security types identified in the Form D filings. 62.3% of the offerings are identified as equity securities, 23.7% are identified as pooled investment fund interests and 9% are identified as debt securities.[5]
III. Industry Distribution
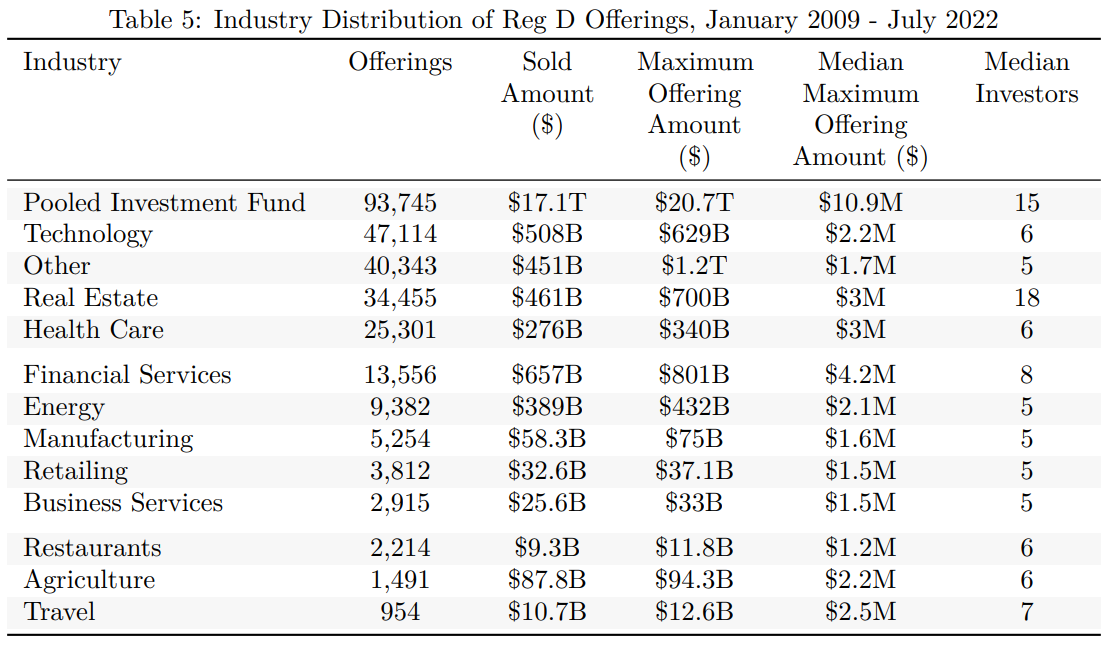
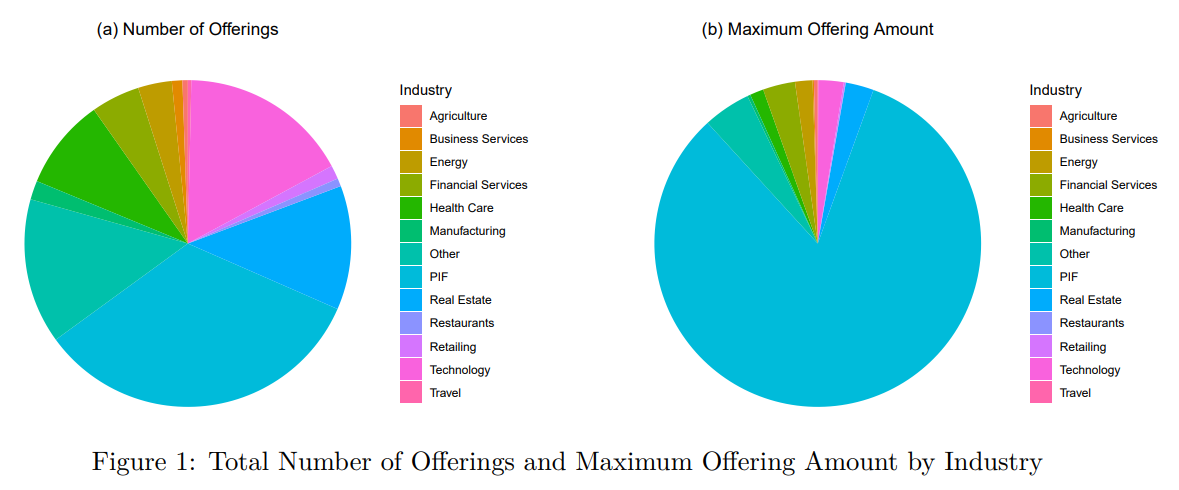
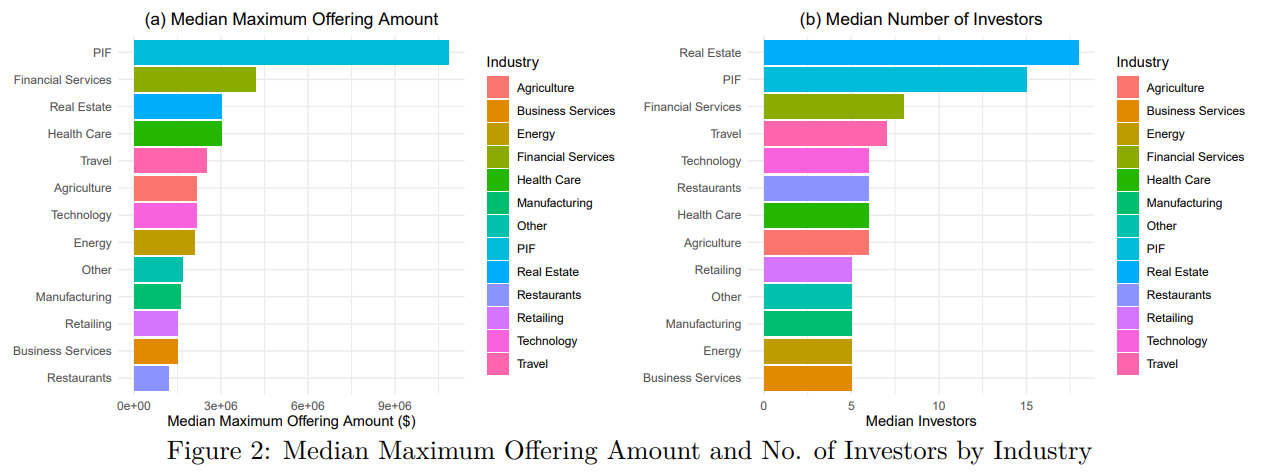
Table 5 and Figures 1(a)-(b) describe the distribution of Reg D offerings sold between January 2009 and July 2022 across issuer industries. Pooled Investment Fund ("PIF") is the largest industry by any measure of Reg D offerings, leading the other industries by a large margin. PIF issuers account for 33.4% of the Reg D offerings and 82.7% of the total maximum offering amount. Technology and Real Estate rank second and third (excluding the "Other" industry), respectively, in terms of the total number of offerings. The Financial services industry ranks second in terms of total maximum offering amount. Figures 2(a)-(b) show that PIF offerings tend to have a larger size and Real Estate offerings tend to attract more investors per offering.
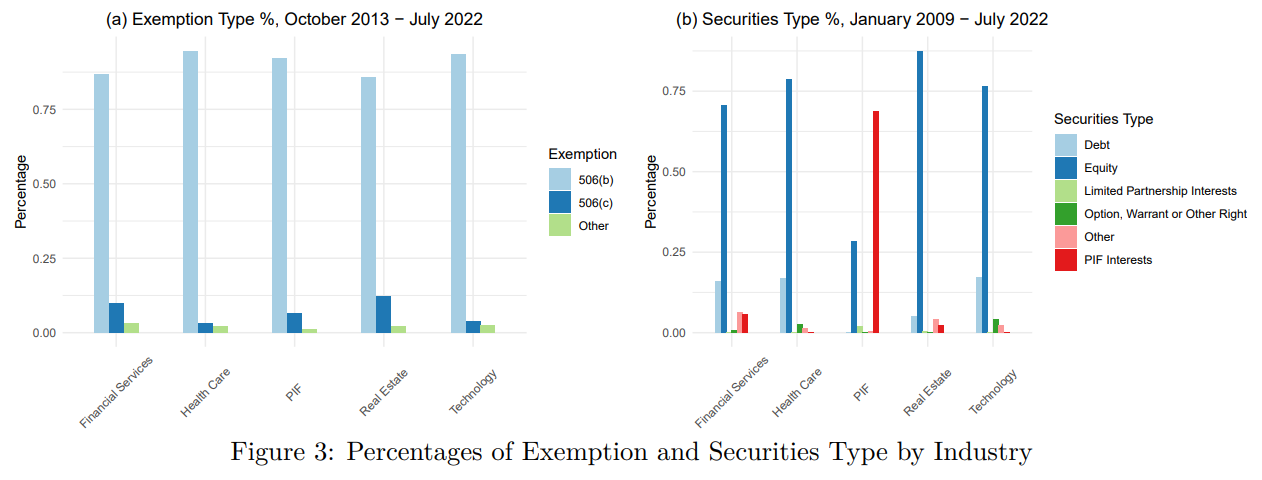
Figures 3(a)-(b) illustrate the distributions of the exemption claimed and the type of securities involved in Reg D offerings across the top five industries ranked by the total number of offerings. Most Reg D offerings claim Rule 506(b) as the reason for exemption. Equity is the predominant fund-raising instrument in all five but the PIF industry, where more than two thirds of the Reg D offerings report "Pooled Investment Fund Interests" as the type of securities offered. Debt securities are used in more than 16% of the Reg D offerings in each of the Financial Services, Health Care and Technology industries, while PIF and Real Estate offerings use Debt securities much less frequently.
IV. Time Trends
Below we present various statistics measuring the intensity of Reg D offerings sold in each year between 2009 and 2021 in the entire market as well as in each of the top five industries in terms of the total number of offerings sold.
All Industries
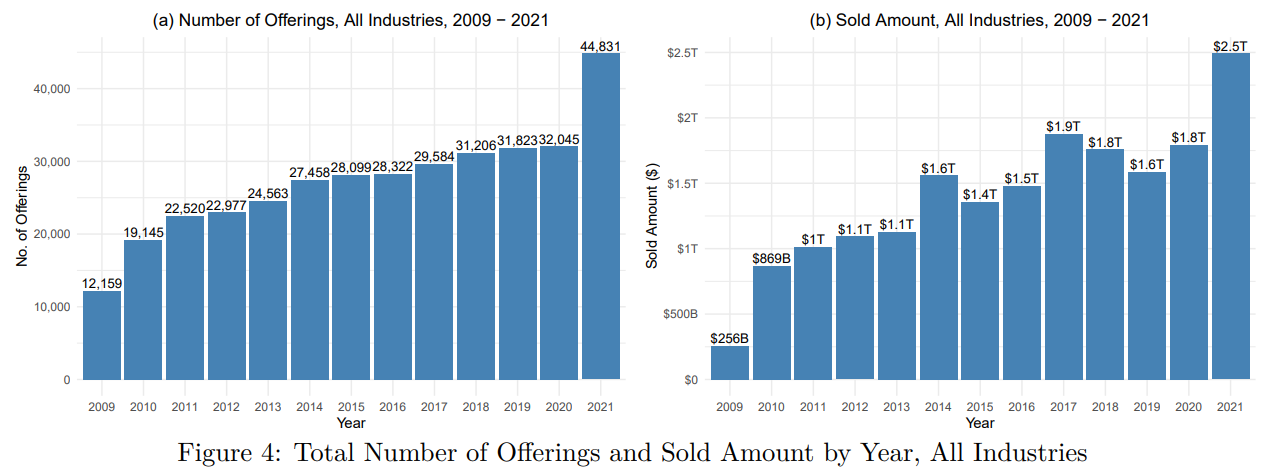
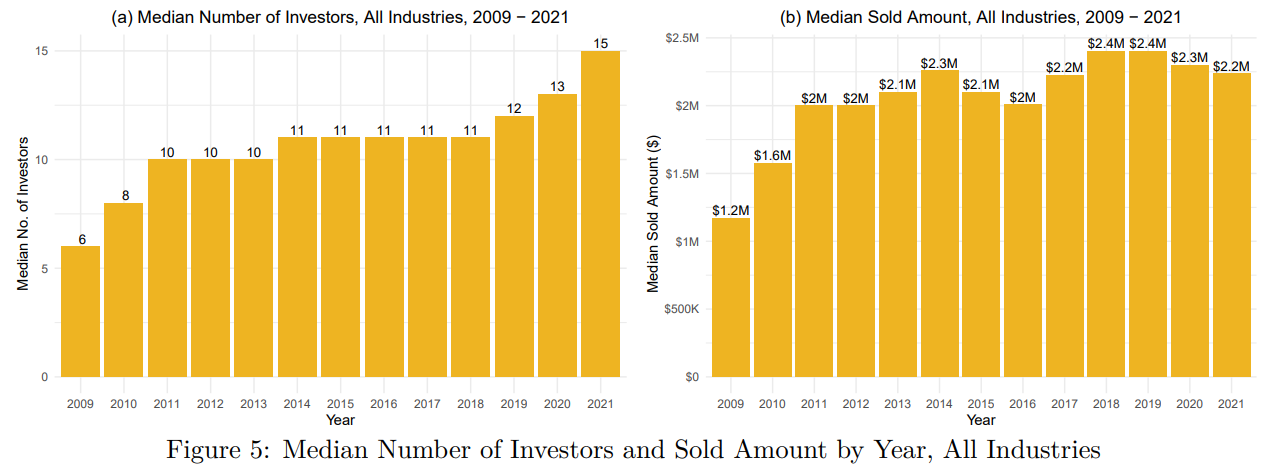
Figure 4(a) shows that the number of Reg D offerings sold was steadily rising from 2009 to 2020 before having a sharp increase in 2021.[6] The aggregate sold amount has also been trending upwards in the 2009- 2021 period, with the amount sold in 2020 and 2021 more than doubled than the amount sold in 2010 and 2011. See Figure 4(b). Recent offerings also tend to be sold to more investors, and more than $2 million was sold in at least half of the offerings in each year after 2010. See Figures 5(a)-(b).
Pooled Investment Fund
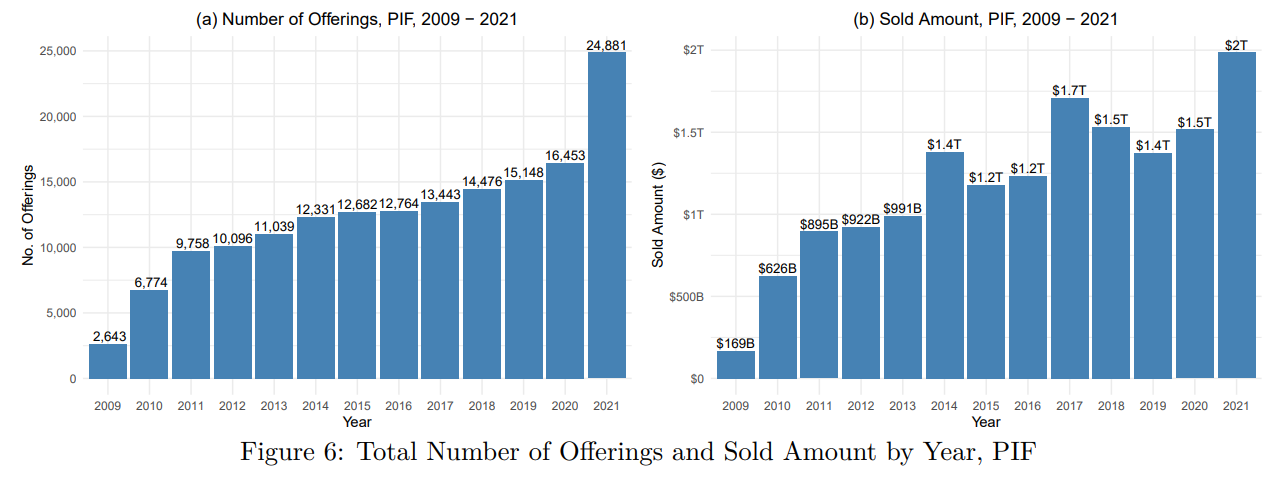
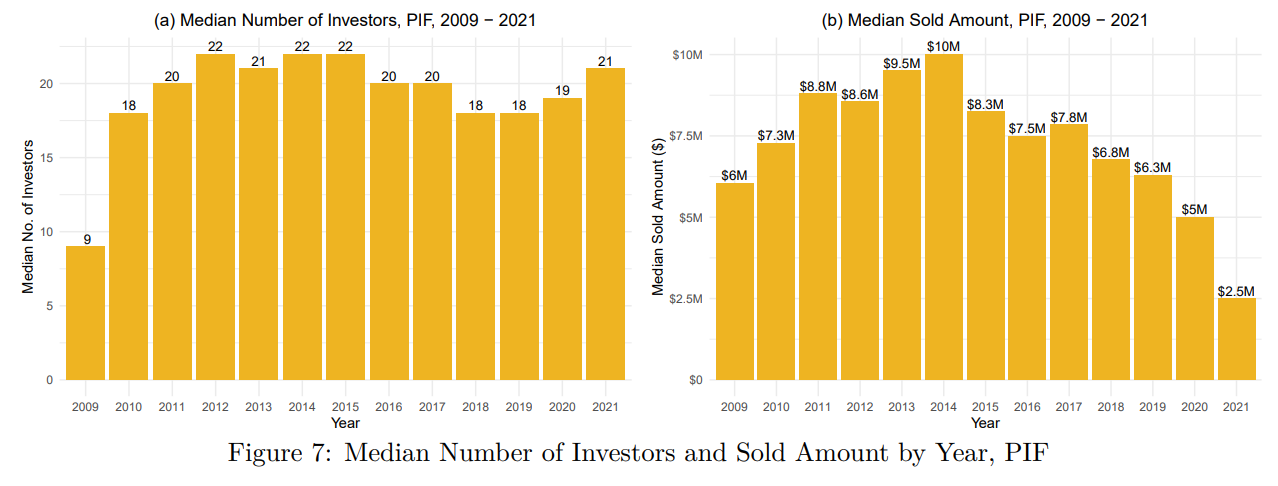
Figure 6(a) shows that the number of offerings with an issuer from the PIF industry was continuously increasing from 2009 to 2020 and rose sharply in 2021. Figure 6(b) shows that the aggregate amount sold by PIF issuers also has an increasing trend. The median number of investors for the PIF offerings had been falling through 2018 and was on the rise during the period 2009-2021, and the amounts sold more recently by PIF issuers tend to be smaller than those sold in earlier years. See Figure 7(a)-(b).
Technology
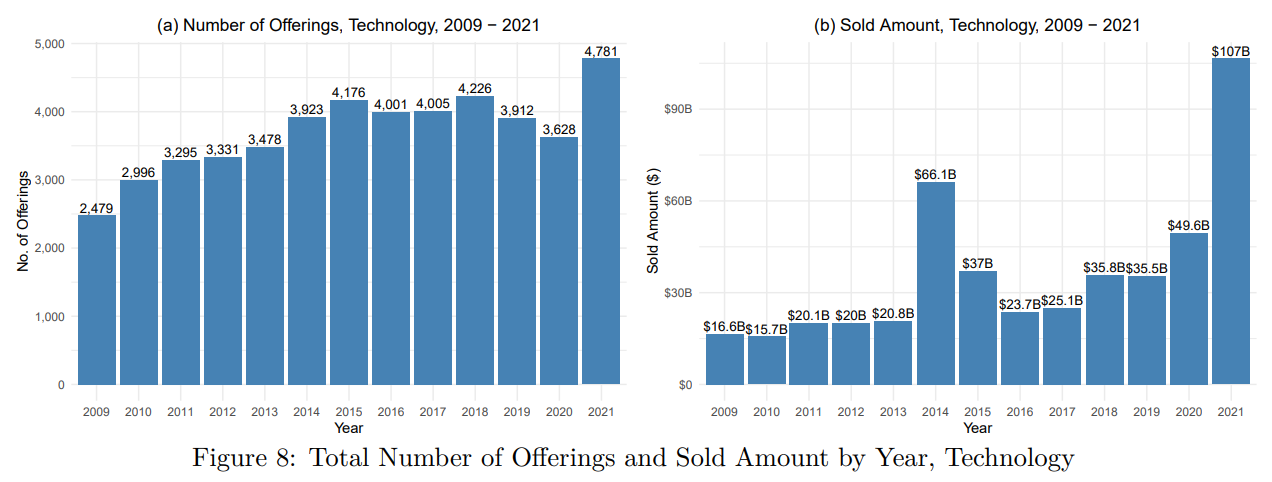
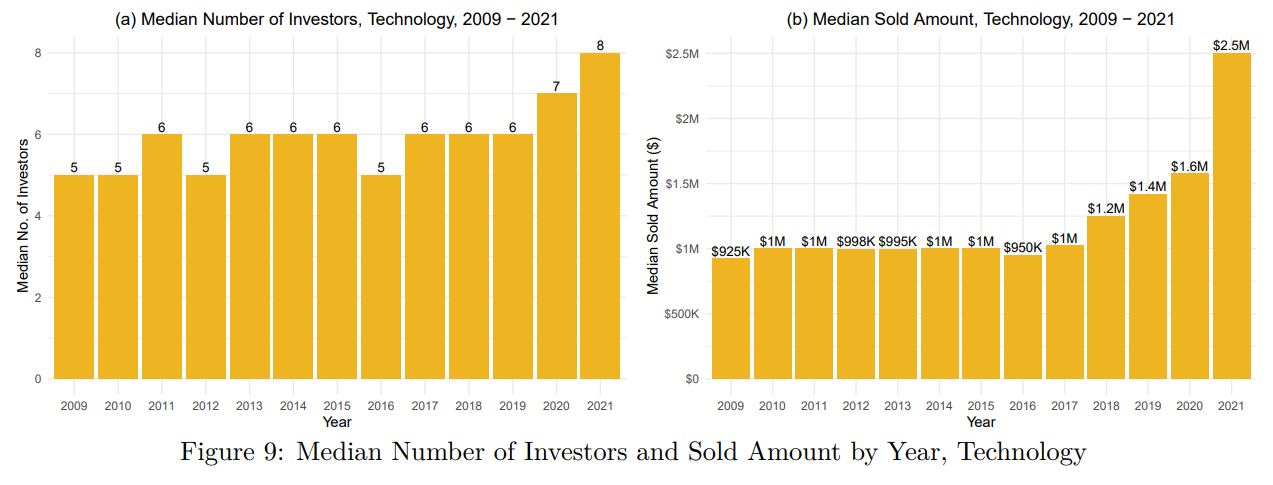
Figure 8(a) shows that the number of Technology offerings was increasing from 2009 to 2015, plateaued between 2016 and 2020 and rose sharply in 2021. Figure 8(b) shows that the aggregate amount sold by Technology issuers has an increasing trend between 2016 and 2021, with the amount sold in 2021 more than doubled compared to 2020. The median amount sold by Technology issuers was also increasing from 2016 to 2021. See Figure 9(b).
Real Estate
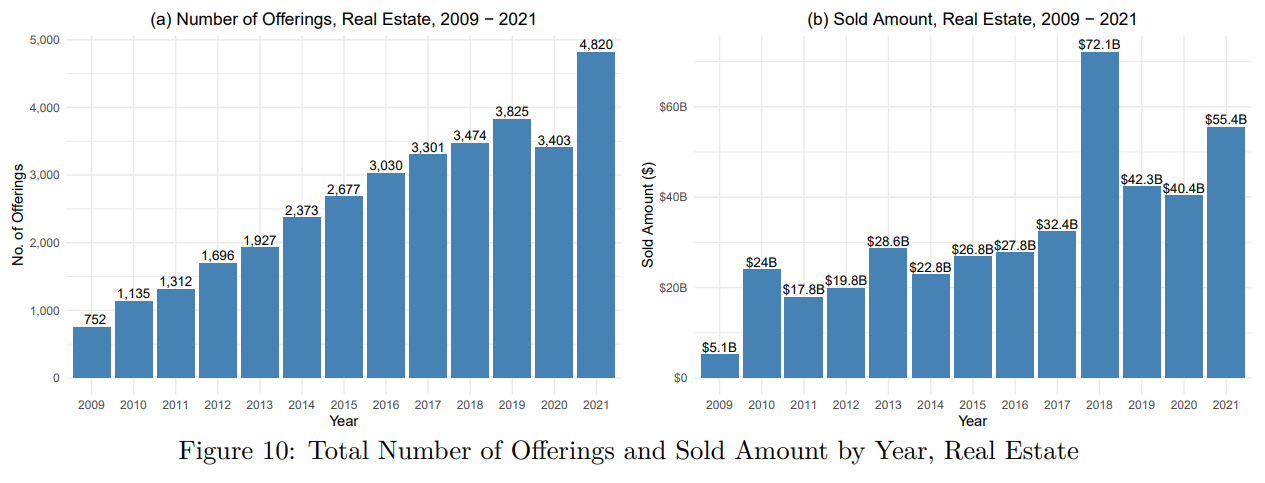
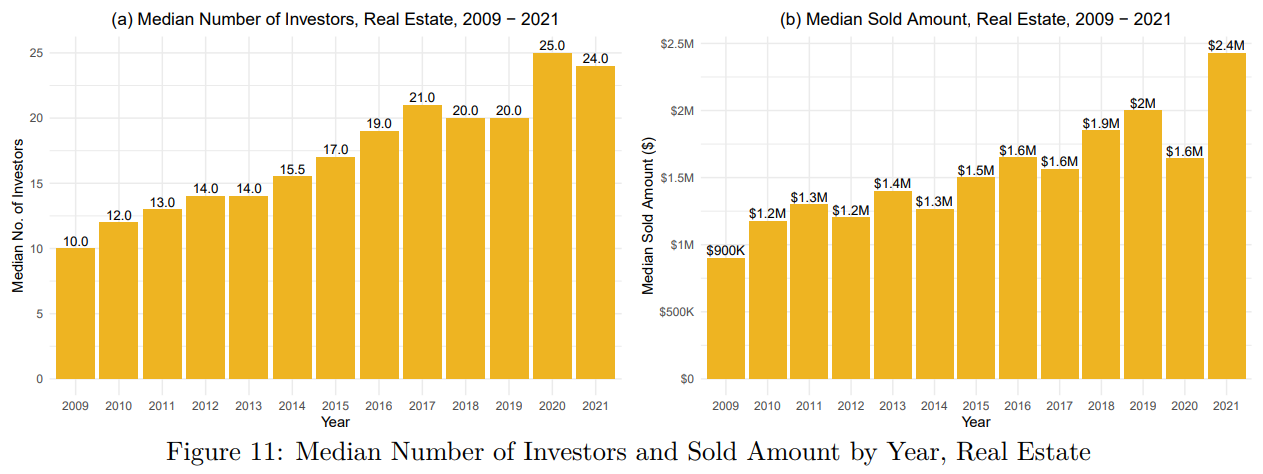
Figures 10(a) shows that the number of offerings sold by issuers from the Real Estate industry was growing continuously and rapidly from 2009 to 2021 with the only exception of 2020. The aggregate amount sold by Real Estate issuers also has a increasing trend from 2011 and after. See Figure 10(b). Figures 11(a)-(b) show that Real Estate offerings sold more recently tend to be sold to more investors and have a larger size than earlier offerings.
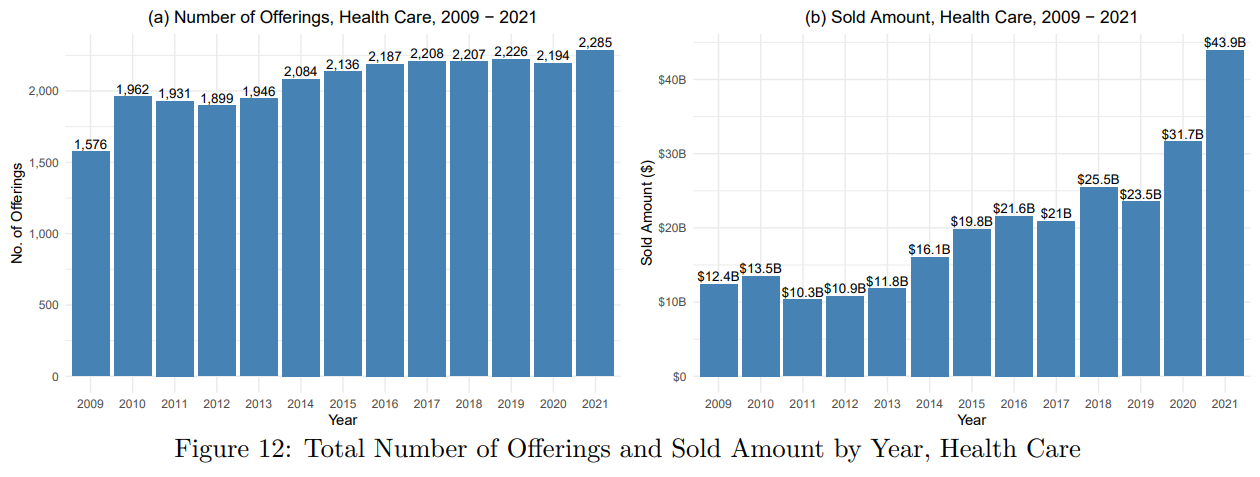
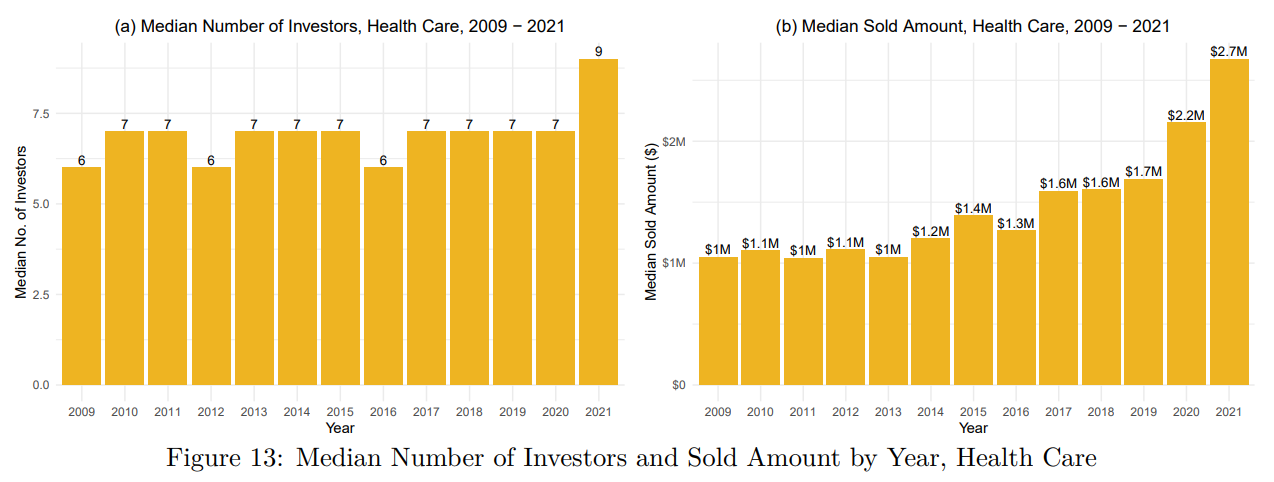
Health Care
Figure 12(a) shows that the number of Health Care offerings has increased moderately since 2010. Figure 12(b) shows that the aggregate sold amount in the Health Care industry has an increasing trend from 2011 and after and was rising quickly in recent years, with a year-over-year increase of 35% or more in 2020 and 2021. The median sold amount has a similar rising trend. See Figure 13(b).
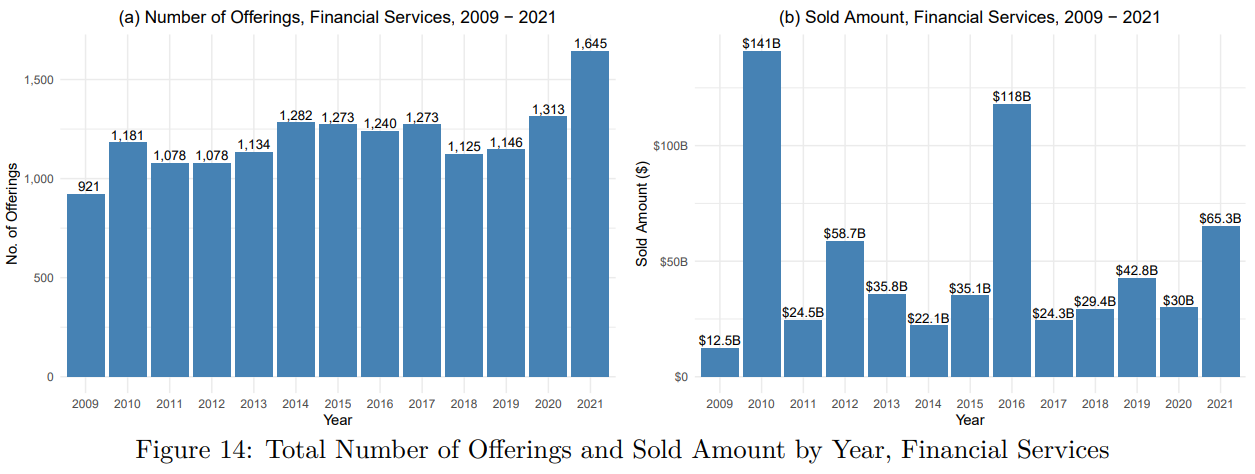
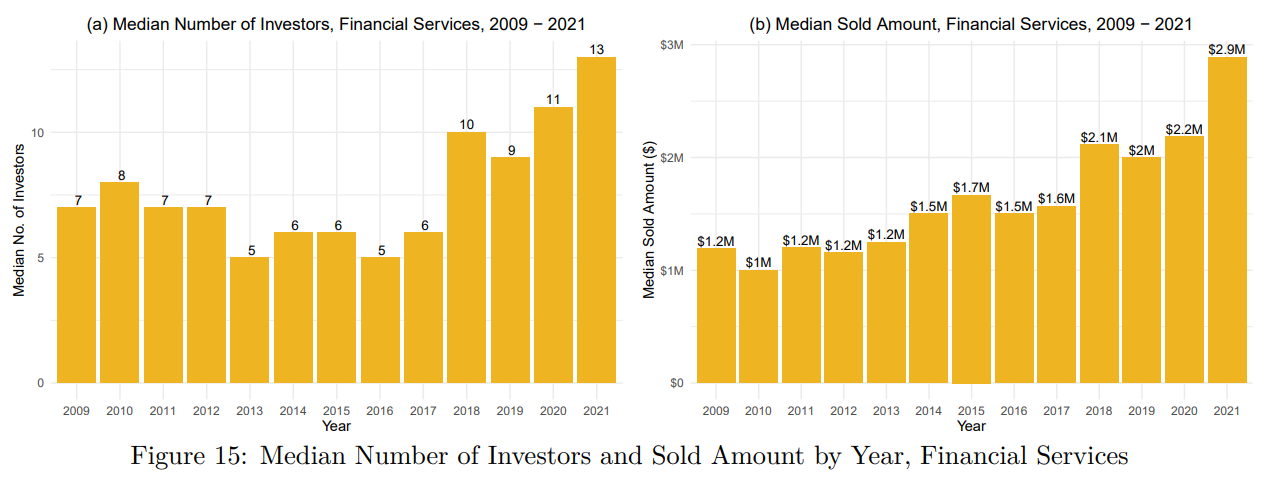
Financial Services
Figure 14(a) shows that the number of offerings sold by issuers from the Financial Services industry has experienced relatively little change from 2009 to 2019 before starting to rise more quickly in 2020 and 2021. Figures 15(a)-(b) show that the median number of investors and the median sold amount in Financial Services offerings both have an upward trend between 2016 and 2021.
V. Conclusion
Securities issuers increasingly sell unregistered securities making almost no information about their business and the offering publicly available. In 2019, over $1.5 trillion in unregistered securities were issued - most sold pursuant to Rule 506(b) and so likely sold to nonaccredited investors.
The dramatic increase in exempt offerings sold to nonaccredited investors and the lack of information on issuers raises very serious investor protection concerns. Without reliable market values, investors who bought broker-sold Reg D offerings may not know they have suffered losses or suspect their broker of misconduct; investors who buy exempt securities directly from issuers have even less information and less recourse.
We report summary statistics based on our review of all Form D reports filed with the SEC from January 1, 2009 through July 31, 2022. We present the number, dollar amount raised and other characteristics of the securities offered under Regulation D in aggregate and broken out by issuer's industry and the year of first sale. Our next installment will narrow our focus to broker-sold Reg D securities. Future installments 10 will document the connection between Reg D sales and customer complaints against brokerage firms and illustrate specific examples of potentially problematic offerings.
[1] Accredited investors must have $200,000 in annual income individually or $300,000 jointly for two years and an expectation of passing the same thresholds in the current year or $1,000,000 in net worth excluding their primary residence.
[4] The maximum offering amount of an offering is defined as the "Total Offering Amount" in the most recent filing related to the offering. The sold amount is estimated by adding the reported "Total Amount Sold" in the original filing with any additional incremental sold amount reported in subsequent amendment filings. Any amendment filing whose corresponding original filing was not electronically filed is excluded when estimating the aggregate sold amount; this results in an underestimation of the sold amount, especially in the year of 2009.
[5] Form D allows issuers to select "Pooled Investment Fund" as their industry and "Pooled Investment Fund Interests" as the type of securities offered. Some offerings identify more than one security type with the most common combination being "Equity, Pooled Investment Fund Interests".
[6] Although we do not have data from the last five months of 2022, Reg D offerings have not slowed down in 2022: 26,024 offerings were sold in the first seven months of 2021 compared to 26,082 offerings sold in the first seven months of 2022.