Why Citigroup Paid the SEC $180 Million Over MAT/ASTA
Aug 2015
I. Introduction
This week Citigroup paid $180 million to the SEC to settle allegations that Citigroup improperly sold high risk hedge funds known as MAT, ASTA and Falcon. The SEC Order is available to view online.
The SEC Order makes clear that Citigroup did not effectively monitor the portfolio manager or the sales force as it sold billions of dollars of high risk MAT ASTA funds with false and misleading sales presentations. In the end, Citigroup lost hundreds of wealthy clients and likely paid $1 billion in settlements, awards and legal fees. There are close parallels to Schwab's YieldPlus, Regions Morgan Keegan' RMK Funds and soon of UBS's Puerto Rican municipal bond funds. In the end each firm was injured - Morgan Keegan mortally - because it failed a fundamental risk management function. Even if these firms have no independent concern for their clients' well-being, they owe it to their shareholders and employees to monitor the quality of the aluminum siding their Tin Men are peddling.
My firm had significant involvement in the private civil litigation surrounding these Citigroup funds and dozens more which also followed the leveraged municipal bond arbitrage ("LMBA") strategy. Our research culminated in a peer-reviewed article on this strategy. In this note I summarize our prior research so observers can better understand why Citigroup would pay $180 million over its marketing of the hedge funds.
The LMBA funds were marketed based entirely on the false claim that yields on long-term municipal bonds are typically greater than after-tax yields on long-term Treasury securities or swap contracts because of structural imbalances in these markets, not because of greater risks in long-term municipal bonds than in taxable bonds. Leverage was used to magnify the arbitrage profits which the funds claimed could be earned from this strategy.
In late 2007 and early 2008, virtually all LMBA funds suffered catastrophic losses as municipal bond prices declined without offsetting gains on swap contracts. Market conditions that caused large losses in LMBA funds in the 2007-2008 time period were far from unprecedented. Prior to 2007, there were two periods of distress in municipal bond markets during which funds would have exhibited even larger losses than they did in 2007-2008, had they existed during those two periods.
II. The MAT/ASTA Strategy
i. The "muni-puzzle"
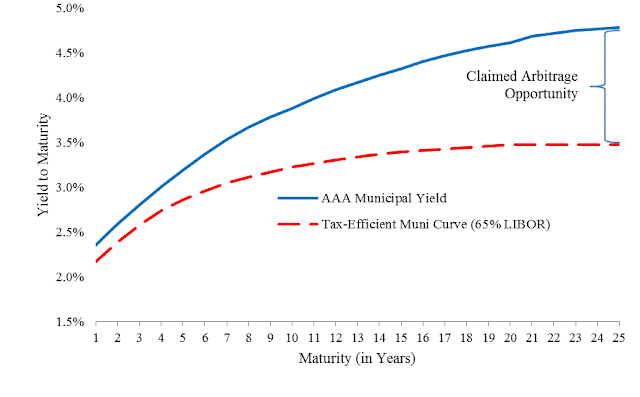
Figure 1 plots the average yield to maturity on municipal bonds and the tax-adjusted LIBOR swap rates using weekly observations of published yield indexes from January 1, 2001 to December 31, 2009. Figure 1 captures a persistent qualitative relationship: yields on AAA-rated municipal bonds are consistently higher than tax-adjusted LIBOR swap term spread and this difference in after-tax yields increases at longer maturities despite the low observed default rates on AAA-rated municipal bonds.
Figure 1. Average Yield Curves from 2001 to 2009
The municipal term spread is consistently greater than the after-tax LIBOR swap term spread. That is, municipal yield curves like the solid (blue) line in Figure 1 are consistently steeper than after-tax LIBOR swap rate curves like the dashed (red) line in Figure 1.
This difference between the term spreads in the tax exempt and taxable markets was sold by brokerage firms to investors as an "inefficiency" resulting from structural imbalances in the municipal bond market. Citigroup and other firms claimed that structural flaws prevented traders from bidding up the prices of long-term municipal bonds so that their yields were no more than the after-tax yields on taxable securities. The hedge funds proposed to circumvent the structural imbalances and capture this arbitrage opportunity by leveraging up portfolios of these "cheap" long-term municipal bonds.
The viability of the leveraged portfolio was highly susceptible to interest rate and market risk and these risks were imperfectly hedged in the taxable market. Some but not all of the positive net cash flow on the municipal bonds was given up in the hedging transactions. Table 1 provides an example of income before fees given the yield curves illustrated in Figure 1.
Table 1. Stylized Difference in Term Spreads on August 31, 2007
Fund managers increased the small net cash flow in Table 1 by leveraging up the portfolio. For example, by leveraging the equity investment 10 times, the stylized fund could provide a tax-exempt gross annual return of 5.90% over 10 years. See Table 2.
Table 2. Stylized Leveraged Municipal Bond Arbitrage
ii. Long-term Municipal Bonds Are Bought With Short-term Debt
At initiation of the strategy, the fund manager invests contributed capital in high-quality assets pledged as collateral to a dealer who forms a trust and issues two classes of securities: senior short-term floating-rate notes, known as variable-rate demand obligations (VRDOs), and junior notes called residual certificates. The proceeds from the sale of the short-term notes are used to purchase additional long-term municipal bonds thus leveraging the residual certificate holders' exposure to the long-term municipal bonds held in the trust.
The interest rate paid by the trust on the short-term notes is reset weekly and is equal to the short-term municipal yield benchmark rate less a market-determined spread. The short-term notes also include a put option, which allows the holders of the notes to sell their bonds back to the trust at par on any reset date. The hedge fund retains the junior residual certificates and pays an interest rate equal to the difference between the interest rate on the underlying long-term municipal bonds and the interest paid to the short-term, senior note holders, less the trust's expenses.
iii. The Leveraged Strategy Was Imperfectly Hedged With Interest Rate Swaps
Once the portfolio manager has leveraged up the investors' capital by financing it with short-term debt, the fund is exposed to tremendous interest rate risk. This is the classic Savings & Loan problem: borrowing short-term at variable rates to fund long-term, fixed-rate investments.
Hedge funds used interest-rate swaps to hedge both the long-term and short-term interest-rate risk. Since the hedge fund has financed an investment in long-term, fixed-rate bonds with a series of short-term floating-rate notes, it enters into a swap agreeing to pay a fixed interest rate in exchange for receiving floating-rate cash flows.
Ideally, the hedge fund would pay a fixed rate that is slightly less than (but perfectly correlated with) the yield it receives on the municipal bond portfolio and would receive a floating interest rate that is slightly higher than (but perfectly correlated with) the interest rate paid on the floating rate notes sold to the money market funds for a term equal to the average maturity of the municipal bonds held. If the hedge fund could enter into such an idealized swap it would be very close to a true arbitrage opportunity; the hedge fund would receive positive net cash flows and any change in the market value of the leveraged municipal bond portfolio would be exactly offset by changes in the mark-to-market value of the interest rate swap.
iv. The Leveraged Strategy Was Extremely Sensitive to Yield Changes
The use of leverage in the strategy made MAT, ASTA and Falcon extremely sensitive to changes in the difference between municipal bond yields and after-tax swap rates. For example, if the duration of the underlying bond portfolio is 10 years and the portfolios is leveraged 10-to-1, an increase of 0.50% in the difference between the long-term municipal bond yields and the swap rates would cause the NAV to drop by 50%. Swap contracts were a useful hedge for the interest rate risk arising out of the funding mismatch in the leveraged municipal bond portfolio if and only if changes in swap rates were highly correlated with changes in long-term municipal bond yields.
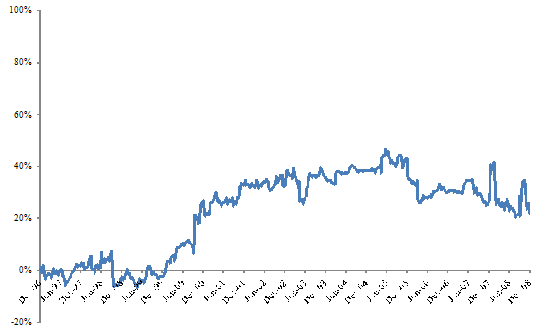
Figure 2 plots the correlation between weekly changes in 20-year municipal yields and weekly changes in 20-year LIBOR swap rates. In the late 1990s, the correlations based on yield changes were sometimes negative. Funds or brokers that represented the effectiveness of hedging strategies using correlations based on levels of yields substantially overstated the effectiveness of the LIBOR hedges.
Figure 2. Correlation Between Weekly Changes in 20-year Municipal Bond Yields and Changes in 20-Year Swap Rates
III. Differences in Yields Reflected Well Known Risks, Not Arbitrage Profits
i. Assumption of Municipal Market "Inefficiency"
The option features and the liquidity risk in AAA-rated municipal bonds explain most of the difference in after-tax yields on municipal and taxable bonds at longer maturities. Credit risk explains the remaining difference in yields, especially for lower quality bonds.
ii. Embedded Options
Yields to maturity on bonds with embedded options, such as callable municipal bonds, cannot be directly compared to yields on option-free bonds because the bonds will be redeemed or "called" before maturity if the municipal issuer can refinance the bonds at lower interest rates once the bonds become callable. The issuer's right to call the bond makes the bond less valuable to investors than an otherwise equivalent bond that can't be called away at the discretion of the issuer. The lower price on the callable bond compared to the otherwise identical non-callable bond is reflected in the higher stated yield to maturity on the callable bond. This higher yield to maturity on the callable bond though is a mirage since there is a good chance the bond will not exist to maturity.
iii. Liquidity
In addition to being comprised mainly of callable bonds, the municipal bond market is less liquid and more fragmented than the market for Treasury securities and swap contracts. Many long-term municipal bonds only trade a few times after they are issued. Since investors bear the risk that they might have difficulty liquidating positions in municipal bonds in the future, there is usually a liquidity premium included in the yield. In contrast, Treasury securities are issued by a single entity (the U.S. Treasury) in approximately 10 different maturities of bills, notes and bonds. As a result, Treasury markets are highly liquid. In addition to spot markets, a large and liquid Treasury futures market exists.
Wang, Wu and Zhang (2008) find that on average between July 2000 and June 2004 the liquidity risk premium accounts for 67 basis points of the yield to maturity on 20-year AAA-rated non-callable municipal bonds. Wang Wu and Zhang (2008) found liquidity risk effectively explains all the difference in after tax yields on high-quality municipal bonds and Treasury securities after controlling for embedded options.
IV. Analysis of an Apparent Example Arbitrage Opportunity
We conducted a simple empirical test to determine whether the spread between stated municipal yields to maturity and after-tax Treasury yields from January 2005 through March 2008 could be explained by embedded call options and liquidity risk premium consistent with the prior 30 years of published literature. We first selected all U.S. AAA municipal bonds issued from January 2000 to January 2007 maturing between 2030 and 2040 available on Bloomberg. From those 900 bonds, we selected 50 bonds to create a portfolio that mimicked the MMAI index in 2005, another portfolio of 50 bonds that mimicked the MMAI index in 2006 and a third portfolio for 2007 and early 2008. For each month, we applied Bloomberg's callable bond valuation analytic "OAS1" to calculate the option-adjusted spread for each bond in the three 50-bond portfolios using the implied volatility from LIBOR caps.
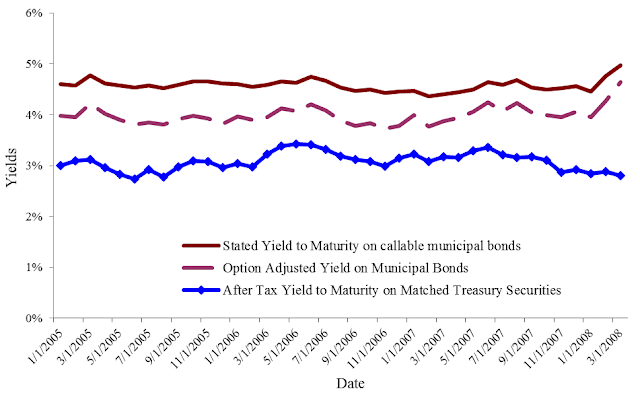
Figure 3 plots the stated yield to maturity and the option-adjusted yield for the 50-municipal bond portfolios and the after-tax yield on Treasury securities with the same maturity at each month-end from January 31, 2005 to March 31, 2008.
Figure 3. Embedded Call Options in Municipal Bonds 2005-2008
Yields to maturity on our 50-bond portfolios between January 31, 2005 and March 31, 2008 averaged 4.58%; embedded call options accounted for 63.3 basis points of the 147.6 basis point average difference between municipal yields and the after-tax yields on Treasury securities. Thus roughly 43% of the difference in yields brokerage firms claimed was an arbitrage opportunity during this period was simply the brokerage firms' overstatement of the comparable yields on municipal bonds. The remaining difference between the option-adjusted yield on municipal bonds and the after-tax yield on Treasury securities averaged 84.3 basis points.
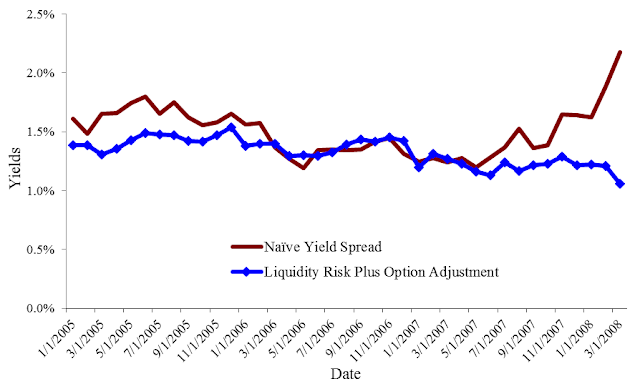
Figure 4. Embedded Call Options and Liquidity Risk Premium Explain the Difference in Yields
Figure 4 plots the naive difference between municipal bond yields and the after-tax Treasury yields marketed as an arbitrage opportunity along with the required adjustment for embedded options and the liquidity risk premium for our three 50-bond portfolios based on Wang, Wu and Zhang (2008). Our average estimated liquidity risk premium for January 2005 through April 30, 2007 is 74.7 basis points. From January 2005 to April 2007 option costs and average liquidity risk explain 138 basis points of the 147.6 basis points the brokerage firms marketed as an arbitrage opportunity. Thus effectively all the claimed arbitrage opportunity resulting is an overstatement of the yields on the municipal bonds and as compensation for liquidity risk.1
_______________________________________
1Credit default swap premiums on mono-line insurance carriers were higher in 2005 and in late 2007 and early 2008. As the perceived credit quality of the companies who had rented their creditworthiness to the municipal issuers declined, yields on these bonds began to reflect compensation for credit risk.
V. The Leveraged Municipal Arbitrage Strategy Was Much Riskier Than Municipal Bond Portfolios
Citigroup marketed MAT and ASTA funds as high-yielding alternatives to conventional municipal bond portfolios. However, using historical market data, we show that not only was the leveraged municipal arbitrage strategy more volatile than municipal bond portfolios, it was sometimes more risky than an investment in the stock market. The leveraged municipal arbitrage strategy did not suddenly become more risky than the stock market or a municipal bond fund as a result of the subprime mortgage crisis. It had been more risky than these alternatives prior to the crisis - during a period when the strategy was being heavily marketed as low risk.
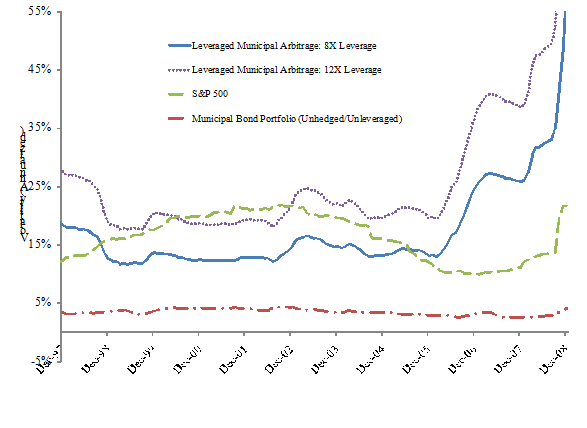
Figure 5 illustrates the results of our simulation analysis. Each point on the graph represents the forecasted one-year volatility at a given point in time. For example, the volatility estimate for the leveraged municipal bond strategy (with 8X leverage) in January 2004 is 14.4%. This means that using weekly spread data from the three years prior to January 2004, the return volatility over the following 12 months was projected to be 14.4%. Only data available prior to each volatility forecast is used to make the forecast and so brokerage firms could have made the same forecasts at the beginning of each month shown on the graph.
Figure 5. Annualized Volatility of Returns
As Figure 7 shows, the large losses experienced by LMBA strategies were not a "surprise" attributable to the subprime mortgage crisis. The strategy, using either 8X or 12X leverage, was more risky than a conventional municipal bond portfolio in every month from December 1997 through December 2007, and more risky than the stock market in some of those months. Moreover, the strategy became especially risky toward the latter half of 2006 and at the very beginning of 2007, before the first major eruption of the crisis in February 2008.
VI. Market Conditions Which Led to Large Losses in Funds Were Not Unprecedented or Even Unusual
The firms that marketed LMBA funds to investors claimed that the funds' large losses in 2007 and 2008 were the result of highly unusual market conditions - a "perfect storm" or a "once in a century event."
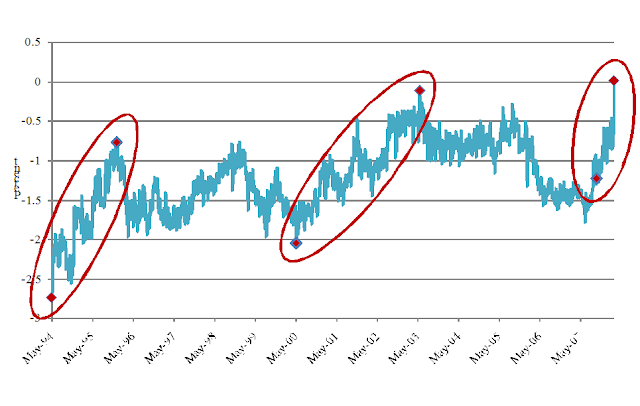
Changes in the spread between the 20-year municipal bond yield and 20-year LIBOR swap rate are directly related to capital gains and losses in the funds. Figure 6 illustrates that the spread increased by 1.24% from September 28, 2007 through February 29, 2008, a period during which many of these funds collapsed. The spread, however, increased by much more than 1.4% in earlier (but still recent) periods of financial distress.
Figure 6. Changes in the Spread Between the 20-Year Municipal Yield and 20-Year LIBOR Swap Rate
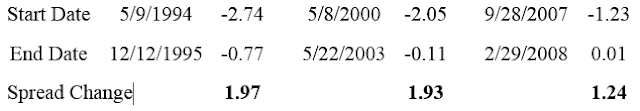
Figure 7
From May 9, 1994 through December 12, 1995 the spread between the 20-year municipal bond yield and 20-year LIBOR swap rate increased by 1.97 percent: .73% more than the spread increase associated with the funds' large losses in 2007-2008.
From May 8, 2000 through May 22, 2003 the spread between the 20-year municipal bond yield and 20-year LIBOR swap rate increased by 1.93 percent: .69% more than the spread increase associated with the funds' large losses in 2007-2008.
A LMBA fund that existed during 1994-1995 or 2000-2003 would have suffered even greater losses than the losses that led to the extinction of LMBA funds in 2008.
VII. Conclusion
Citigroup and other firms marketed the LMBA strategy as a low-risk, high-yield alternative to municipal bonds. The strategy introduced additional risk by leveraging investments in long-term municipal bonds in an attempt to generate enough gross returns from the perceived arbitrage opportunity to cover the brokerage firms' fees and to net a marketable return to investors.
The municipal arbitrage strategy was dependent on hedging large, leveraged, long-term municipal bond positions with taxable interest rate swaps. The correlation between these hedges was quite low making it likely that they would fail. As long-term municipal yields increased more rapidly than the swap rates over many months, the hedging strategy in fact did fail. In February 2008, the municipal bond prices fell further and leveraged municipal bond portfolios were liquidated. Much of the losses though had occurred earlier during relatively routine interest rate environments.