Variable Annuity Fees Linked to the VIX -- Part II
Nov 2013
In our last post, we discussed a whitepaper that proposed linking the fees in a variable annuity to the CBOE Volatility Index (VIX). That paper ran a simple backtest of a variable annuity fee tied to the VIX over the period from 1990-2012, assuming certain parameters, and then compared the result to a fixed fee annuity over the same period. We have replicated their approach between January 1990 and January 2013 and found that not only are the fees and ending account values comparable, but so are the aggregate amount of withdrawals. We confirmed that a multiplier of approximately 5 results in a comparable average daily fee between the VIX-based variable fee account and the fixed fee account.
This example illustrates some properties of a VIX-linked fee, but is a bit simplistic. We found an actual variable annuity that uses this type of fee structure:the SunAmerica Polaris line of variable annuities (see the Appendix in each prospectus). What they use is a bit more complicated.
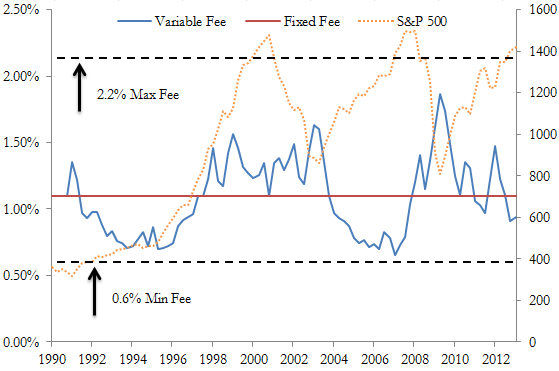
The annualized fee for theSunAmerica productsis fixed for the first year (at 1.10%) but in later years fluctuates based on the value of the VIX, similar to the whitepaper's example. However, the VIX-based fee is subject to a minimum (0.60%) and a maximum (2.20%), and cannot decrease or increase by more than 0.25% per quarter. The formula for the annualized quarterly fee is:
Initial Annual Fee Rate + [0.05% * (Average Value of the VIX - 20)]
subject to the above constraints. The average is calculated based on the daily market close on all days during the relevant quarter (we assume they mean the close on any trading day).
Because of these additional constraints, the VIX-based fee on the Polaris product is less sensitive to VIX movements than the simple example in the CBOE whitepaper. However, it is still negatively correlated with the S&P 500, and does fluctuate a great deal:
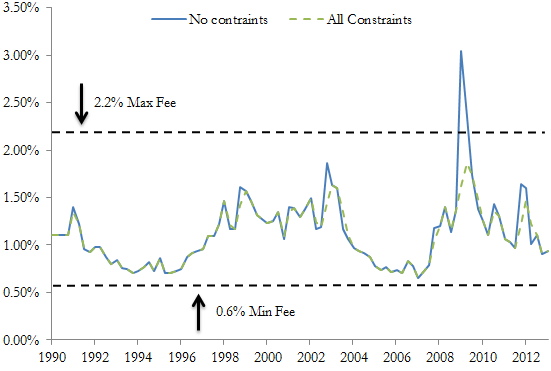
Interestingly, if the provision that the fee cannot increase by more than 0.25% per quarter is relaxed, the fee would have hit the maximum level during the recent financial crisis and, in the absence of the cap, would have exceeded the cap.
In the following figure, we plot the fees that would have been applied in the absence of the constraints (cap, floor and maximum increment) along with the applied fees for the variable account above. This unconstrained alternative is similar to the simplistic approach used in the CBOE white paper.**
It is clear that the constraints make little difference except during the financial crisis of the late 2000's. While this calculation is described in the prospectus, there is no discussion of the VIX itself, most notably its negative correlation with the S&P 500. In fact, the only description of the VIX states simply that it is "an index of market volatility reported by the Chicago Board Options Exchange," and that if the market is in a period of high volatility the fee will increase and if in a period of low volatility it will decrease. The product brochures do not mention the VIX at all. Unsophisticated investors may not realize that this means their fee is likely to grow when their account values are declining, unlike traditional variable annuities.
_______________________________________
** The simplistic approach of the CBOE white paper does not explicitly mention averaging the VIX levels, but we averaged for the sake of comparability.