Equal Weighting versus Market Capitalization Weighting
Apr 2013
We often hear about different stock market indexes in the same breath: on the evening news, you might hear that 'the Dow was up half a percent, the S&P gained three quarters of a percent, the NASDAQ was down a tenth of one percent'. While it may seem that these indexes tend to move together on most days, there are important differences between equity indexes. The one we hear about the most is that they are composed of different stocks: the Dow Jones Industrial Average tracks only 30 companies, whereas the S&P 500 tracks 500 and the NASDAQ tracks 100 mostly technology stocks. But one potentially overlooked difference between these indexes is how they weight each stock in the index.
An index weighting scheme determines the rules by which weights are determined for the components of an index. Market capitalization indexes weight components with larger market capitalization more heavily than components with relatively smaller market capitalization. The S&P 500 is a market capitalization index that includes 500 large capitalization US equities. Apple (AAPL) is one of the heaviest weighted components in the S&P 500 and as a result has a larger effect on the returns of the index relative to smaller constituents.
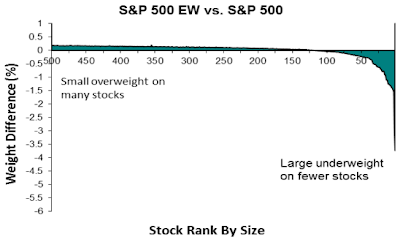
Equal weighted indexes, like the S&P 500 Equal Weight Index, simple weight each component equally. In the case, Apple has approximately the same weight (about 0.2%) as any otherconstituentof the index. S&P recentlyreleased a report on the equal weighted index, and Exhibit 2 in the report (reproduced below) shows the difference in weight for the constituents between the equal-weighted and cap-weighted S&P 500.
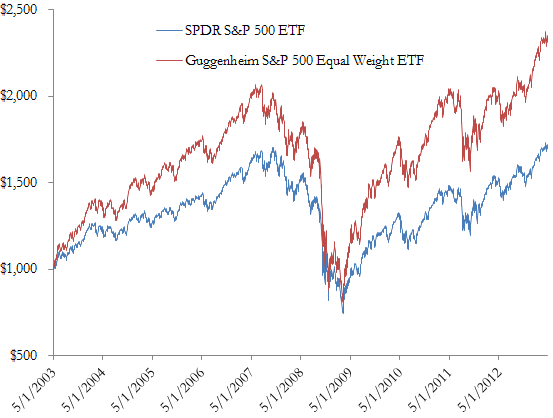
This equal-weighted version of the S&P 500 has garnered significant attention since it has performed much better than the market capitalization weighted index. In the following figure we compare an investment in the SPDR S&P 500 ETF (SPY) -- which tracks that market-capitalization weighted version -- and the Guggenheim S&P 500 Equal Weight ETF (RSP) from May 2003 to yesterday.
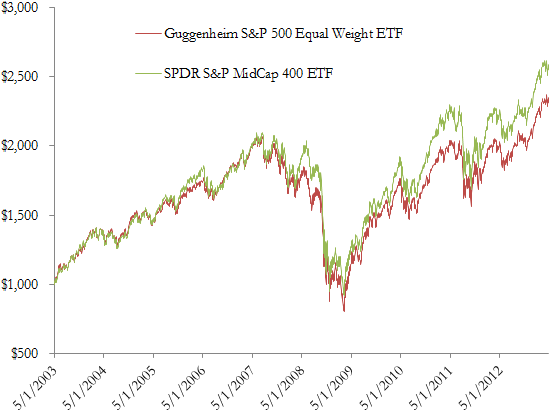
The investment in RSP would be worth about $2,350 while an investment in SPY would only be worth about $1,700. It has been suggested that RSP is more aptly compared to a midcap ETF, such as the SPDR S&P MidCap 400 ETF (MDY). MDY tracks the S&P MidCap 400 Index which is market-capitalization weighted index focused on mid-capitalization US equities. Indeed the performance of these two investments seem to resemble one another more closely (although, statistically speaking, RSP actually exhibits a lower correlation with MDY than SPY over this time period).
A $1,000 investment in MDY would be worth about $2,600 today. MDY has a lower expense ratio (0.25% versus 0.40% of RSP) which should explain some of RSP's underperformance. Vanguard's MidCap ETF (VO) has also been suggested as an even lower-cost alternative to RSP. It makes some intuitive sense that an equal-weighted large-cap ETF resembles a market-capitalization weighted mid-cap ETF since the equal-weighted index decreases the weight on the megacaps and increases the weight on the lower capitalization components.
What is clear from S&P's report is that the weighting scheme of an equity index makes a big difference. If an equal-weighted S&P 500 were reported on the news every night, investors might have a different impression of how the stock market has been doing.