How Big of an Effect Does Securities Lending Have on ETF Returns?
Feb 2013
We earlier posted an analysis that compared ETF returns to their stated index net of fees for funds that lend securities and those that do not. IndexUniverse subsequently suggested an approach with methodological differences from our original work and we wanted to address some of those differences here.
For our sample, we used Bloomberg's ETF function to collect all US-domiciled, USD-denominated exchange-traded funds and removed any with active trading strategies, leverage, or inception dates after January 1, 2010. We then restricted ourselves to funds that hold only US equities, independent of market capitalization. We used daily data from between February 16, 2012 and February 15, 2013 for our analysis.
We then checked whether the underlying index for each ETF as reported by Bloomberg was a total return or a price return index. Based on IndexUniverse's calculation methodology, we compared the fund's total return (based on NAV) to the return of the index minus the fund's expense ratio for funds that track a total return index. For funds that track a price return index, we compared the fund's NAV return to that of the underlying index, again minus the expense ratio. We then aggregated these results for ETFs that participate in securities lending programs and those that do not, as reported by Bloomberg.
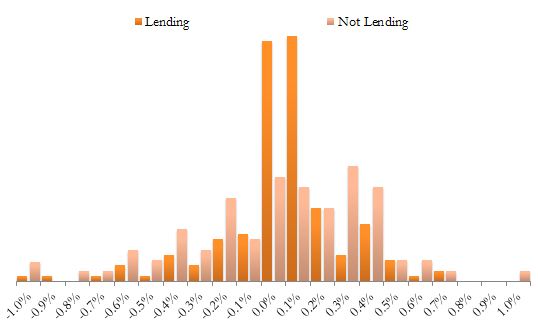
The resulting distributions are shown below:
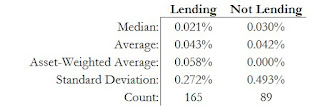
The resulting averages a reminuscule -- just a few basis points on returns that vary on the order of tens of percentage points. While there is a small difference in average, median, and asset-weighted average between the two groups of funds, the standard deviation of these distributions is far larger than those differences. A simple difference of means test shows that funds which lend securities do not outperform their index net of fees by a significant amount when compared to funds which do not lend securities.
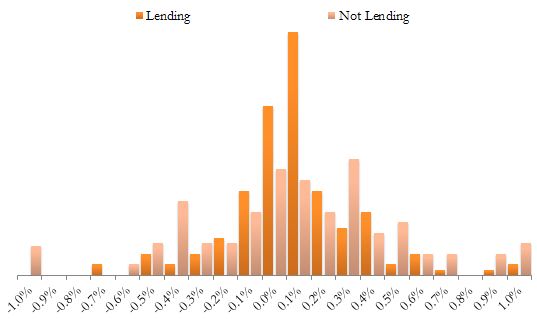
We calculated the same metrics as above based on market price total returns instead of NAV returns, which resulted in the following distributions:
While the average values for each distribution rose slightly using price rather than NAV total return measures, they are again extremely small. In both the lending and non-lending distributions the standard deviation is much larger than the difference in means, suggesting that the effect of securities lending is likely small. It appears that firms that participate in securities lending programs appear to have a lower standard deviation and more clustering around 0%, suggesting that securities lending may enable funds to more precisely track their underlying index. However, given the variation in these data sets, it is difficult to statistically distinguish the two distributions.
This is in contrast to IndexUniverse's finding that "after accounting for expense ratios, ETFs that lend portfolio securities did a demonstrably better job tracking their index." We find no significant difference between the two distributions over the past year. The sample we use here is different IndexUniverse's but we both find a minute effect that is, in the end, likely attributable to noise.