Michael Aneiro over at Barron's pointed out an interesting recent SEC 424(b)2 filing from ETRACS for their Monthly Pay 2x Leveraged Mortgage REIT ETN (MORL). According to the prospectus, the ETNs will "provide a monthly compounded two times leveraged long exposure to the performance of the [Market Vectors Global Mortgage REITs Index], reduced by the Accrued Fees." This ETN is essentially a leveraged version of Market Vectors Mortgage REIT ETF (MORT) which tracks the same underlying index.
The index tracks a portfolio of traded mortgage REITs. For example, the largest component is Annaly Capital Management Inc -- with almost 19% of the index's value -- which is "the largest mortgage REIT on the New York Stock Exchange." Interestingly, there appear to be only 24 components to the index, which could indicate a lack of diversification and higher volatility than a more broad-based index. That would be important to a levered ETN tracking that index because higher volatility can lead to higher holding period return deviations due to rebalancing.
An interesting and relatively uncommon feature of this particular ETN is the use of monthly rebalancing as opposed to the daily rebalancing of leveraged and inverse leveraged exchange traded products that we've talked about so frequently. This essentially means that an investor holding this ETN from the beginning of one month through the end of the month will have a holding period return of approximately twice that of the Market Vectors Global Mortgage REITs Index gross of fees.
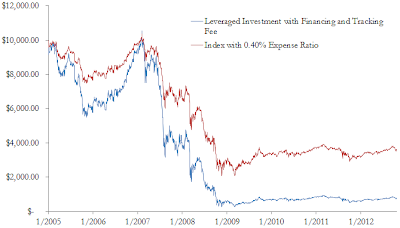
We backtested this strategy from January 2005 to October 2012 by studying a net investment of $10,000 in the Market Vectors Global Mortgage REITs Index (MVMORT) leveraged by 200%. In other words, we borrow $10,000 and put $20,000 in the index.
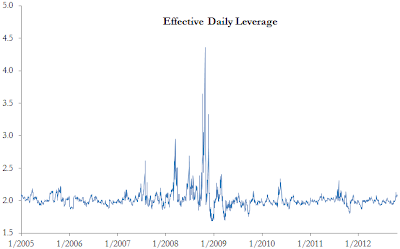
During this period, the unleveraged investment lost approximately 65% of it's value while the leveraged investment lost nearly 95%. As should be expected, the leveraged investment outperforms the unleveraged investment when the index is increasing. Below we plot the effective daily leverage for the leveraged investment over time, which can differ widely from 2x.
While the real estate market in the late 2000s saw heavy losses, these backtests do not look particularly promising for the new ETN. Leveraged ETNs are typically considered for day-trading purposes, while real estate is often considered a diversifying asset class for long-term investors. It is not clear how these two seemingly different approaches will mesh together in this new ETN--but it appears that we will find out.
Details of the backtesting procedure:
We assume the tracking fee is paid at the end of each day and that the short account accrues interest daily at three-month LIBOR plus the contractual 80 basis point financing spread. We compare this to a direct investment in the index with a 40 basis point fee (comparable to that paid by MORT investors). Since investors can invest in the ETNs at any point in the month, the actual exposure the investor experiences is dependent upon the index performance through that point in the month. The average daily leverage is about 2.02 with a standard deviation of about 0.15. The effective daily leverage varied between 1.68 and 4.36 during this period.