Holding an ETF During the Day vs. Holding Overnight
Oct 2012
Lately we've been reading the interesting new book by Eric Falkenstein on risk premia and low volatility investing. We are long time followers of Eric's blog, which has a variety of interesting analyses of equity markets.
Following one of the figures in his book, we decided to look at two different strategies of investing in a given ETF where the holding period is on average one trading day. In particular, we looked at the pricing data of SPDR S&P 500 (SPY) since inception and constructed two investment strategies:
Buy Close/Sell Open: The trader initially invests $100,000 in SPY at the close of business on January 29, 1993 and sells at the opening price on the next trading day (February 1, 1993). Near the close of business, the trader invests the remaining portfolio value in SPY once again and then sells it at the opening price on the next trading day (February 2, 1993), and so on.
Buy Open/Sell Close:The trader initially invests $100,000 in SPY at the opening price on February 1, 1993 and sells at the closing price on the same day. The following trading day, the trader invests the remaining portfolio value in SPY and sells it at the closing price on this day (February 2, 1993), and so on.
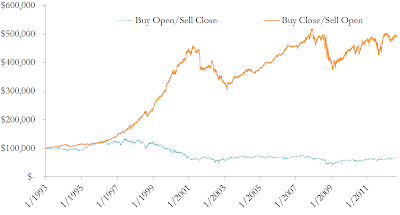
The first strategy is not exposed to the price movements of SPY during the trading day while the second strategy is not exposed to the price movements between the close and subsequent opening of trading. The following plot (basically a replication of Eric's figure) presents the value of these investments over time.
Account Values of Portfolios Investing in SPY by Buying at the Open (Close) and Selling at the Close (Open)
While one might have intuitively expected these two accounts to have roughly the same value over time, the difference in their exposure to SPY leads to vastly different results. Although it could be argued that both incur significant transaction costs, these should be comparable between the two accounts since they both trade the entire portfolio daily. For reference, a buy and hold investor with an initial investment in SPY at inception would have over $328,000 just with price appreciation.
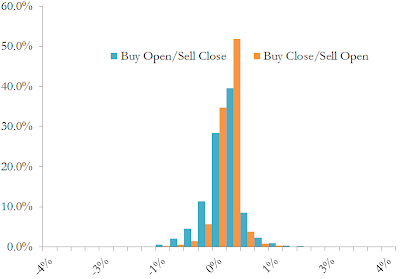
To further analyze these surprising results, we looked at the distribution of returns for the two scenarios and produced a histogram of the results below.
Histogram of Daily Log-Returns for Portfolios Investing in SPY by Buying at the Open (Close) and Selling at the Close (Open)
The distribution of daily returns for the strategy of buying at the close and selling at the open exhibits a mean daily return of about 1.4 basis points and a standard deviation of about 0.3% while the distribution for the alternative strategy exhibits a very small negative mean return and a standard deviation of about 0.5%.
We think that these results are both interesting andcounter-intuitive, and will follow up with more analysis in the coming days and weeks.