Last Friday the Wall Street Journal reported on a new product which combines features of both structured notes and closed-end funds. The eUnit 2 Year US Market Participation Trust IIwas first issued by Boston-based investment company Eaton Vance on May 30. This was the second offering by Eaton Vance of such a product: the first trust with identical name debuted on Jan 26.
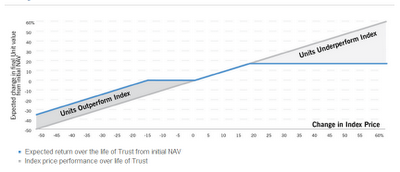
Inessence, the eUnit Trust is like a structured note with capped upside potential and buffered downside loss. At the end of the trust's two-year holding period, if the S&P stock index rises, investors will get an return equal to the index return subject to a cap, with the cap being 17.85% for the first trust and 20.5% for Trust II. If the S&P index drops in value, investors will not get any positive return but won't lose money either as long as the drop does not exceed 15%. If the drop exceeds 15%, however, investors will start to lose money. The payoff structure can be seen from the following graph from Eaton Vance's website.
The innovation in the eUnit Trust lies in the fact that unlike structured notes, the eUnit Trust holds primarily U.S. Treasurys as underlying collateral, thus significantly reducing the default risk suffered by structured notes, as pointed out by our own Craig McCann in the report. By structuring it as a closed end fund which trades actively on the exchanges, the eUnit Trust also reduces the liquidity risk associated with structured notes to a certain extent. According to the Wall Street Journal, "experts say it could be the first of similar products to follow."
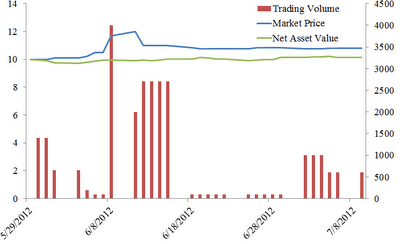
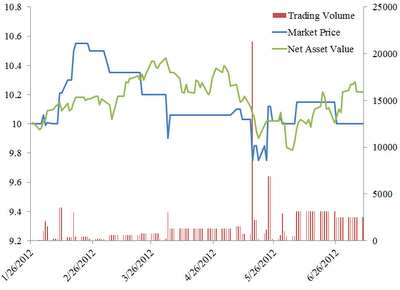
However, investors should still exercise caution when they purchase this new product. For example, trading on the exchange does not mean that the product is not subject to liquidity risk. In fact, both eUnit trusts have been very thinly traded, as shown by the following two figures. The figures depict the market price and the net asset value following the left axis and the daily trading volume following the right axis. The maximum trading volume of theeUnit 2 Year US Market Participation Trust II was no more than 4500 shares, and for two consecutive weeks the trading volume was below 250 shares.